

CEO Red Flags: 5 SEC Filing Checks Before You Buy
Use five SEC filing checks to separate a persuasive CEO story from evidence that deserves more diligence.
CEO Red Flags: 5 SEC Filing Checks Before You Buy Read More »

Use five SEC filing checks to separate a persuasive CEO story from evidence that deserves more diligence.
CEO Red Flags: 5 SEC Filing Checks Before You Buy Read More »

An economic moat can identify a durable business, but it cannot tell you whether the stock or ETF is worth buying. This guide separates rating, evidence, valuation, and portfolio fit.
Economic Moat: Why a Great Business Can Still Be a Bad Buy Read More »
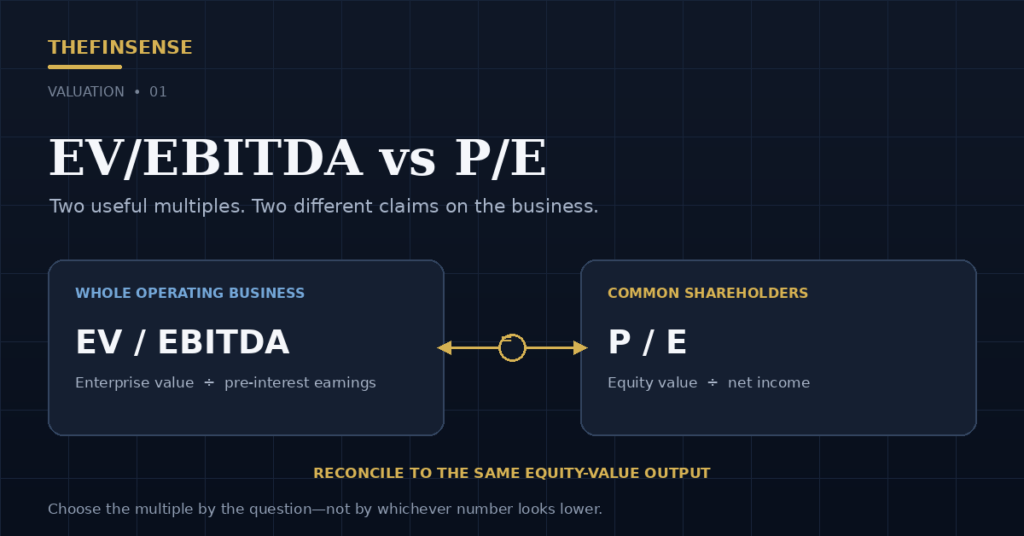
EV/EBITDA vs P/E: a 128.7% distortion, a $214,285 30-year gap, benchmarked against a 12.8x median APAC deal multiple.
EV/EBITDA vs P/E: Which Valuation Multiple Fits the Decision? Read More »
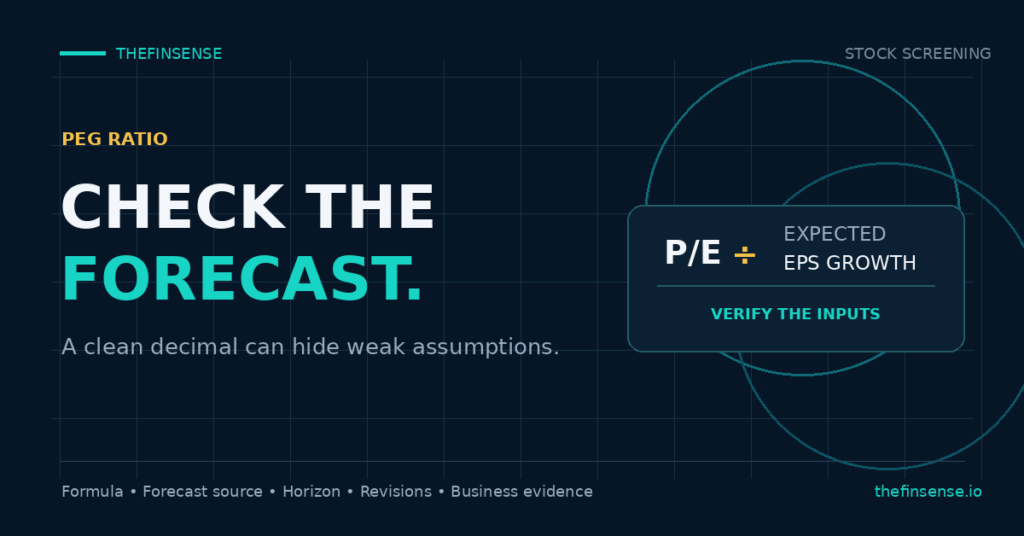
A low PEG can look precise while hiding stale or mismatched growth assumptions. This guide shows how to check the formula, revisions, and business evidence before relying on the screen.
PEG Ratio: Why a Low Number Can Still Mislead You Read More »
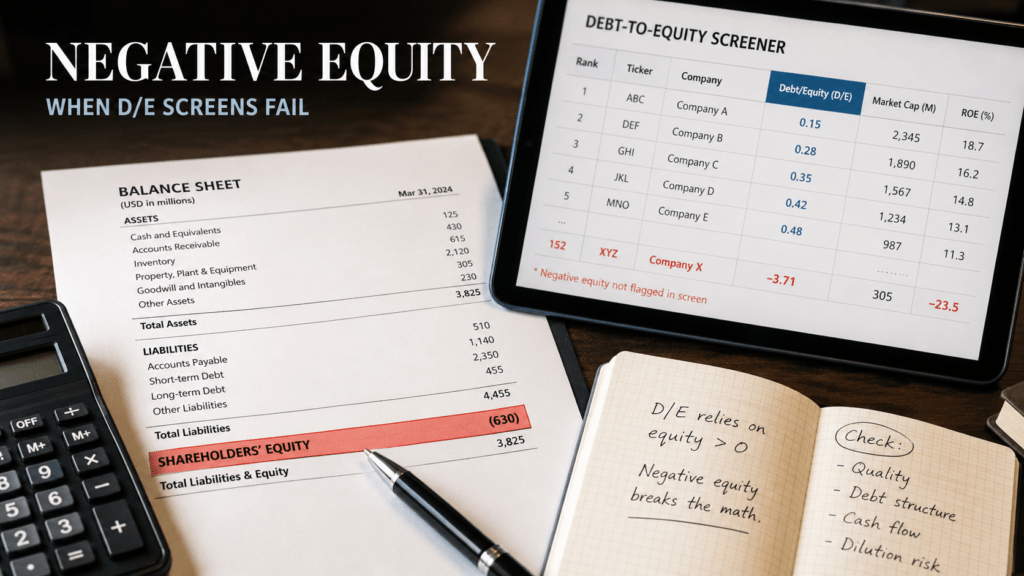
Negative book equity appeared in 27 of 396 S&P 500 non-financial companies in TheFinSense’s April 2026 working paper. This companion explains the three-regime result, the HCA counterexample, the study limits, and how to apply the paper’s E/A rule to one filing.
Why Negative Book Equity Breaks S&P 500 D/E Screens Read More »
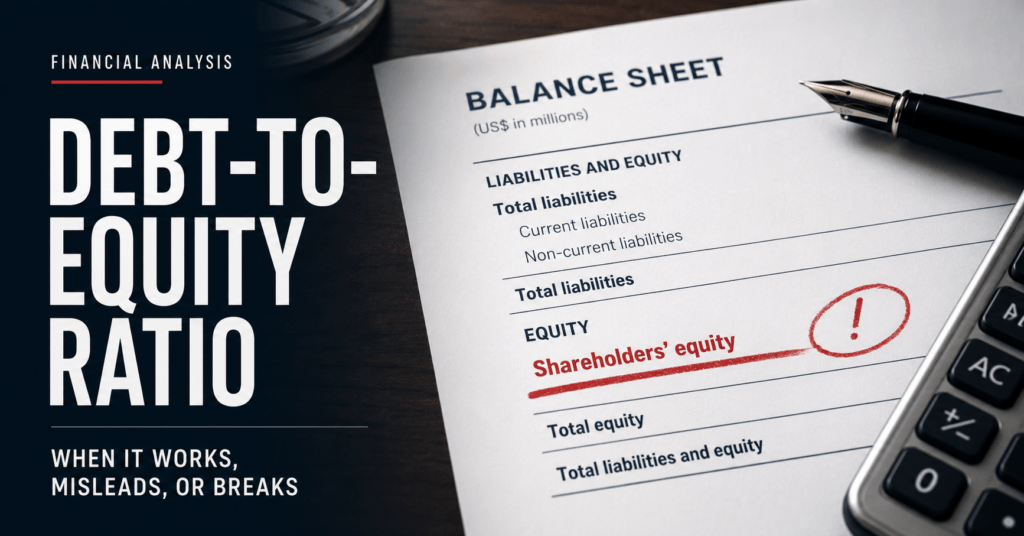
The debt-to-equity ratio stops being a comparison tool once shareholders’ equity crosses zero. A three-regime ladder replaces the single-scale reflex.
Debt-to-Equity Ratio: When It Works, Misleads, or Breaks Read More »
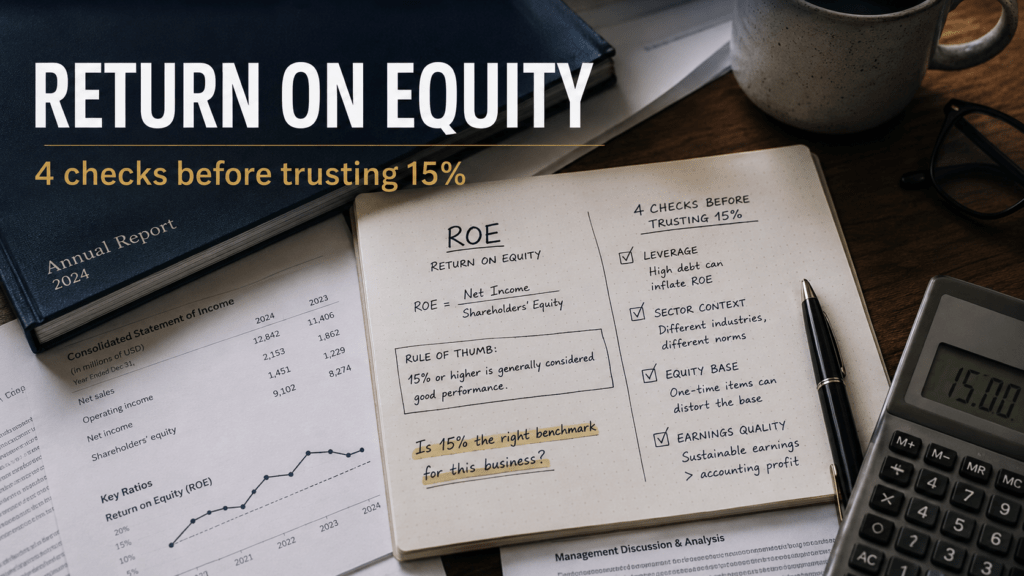
Buffett’s 15% return on equity threshold sits only 0.56 percentage points above the adjusted ex-financial US market average of 14.44%, per Damodaran’s January 2026 dataset.
Return on Equity: 4 Checks Before You Trust a High ROE Read More »
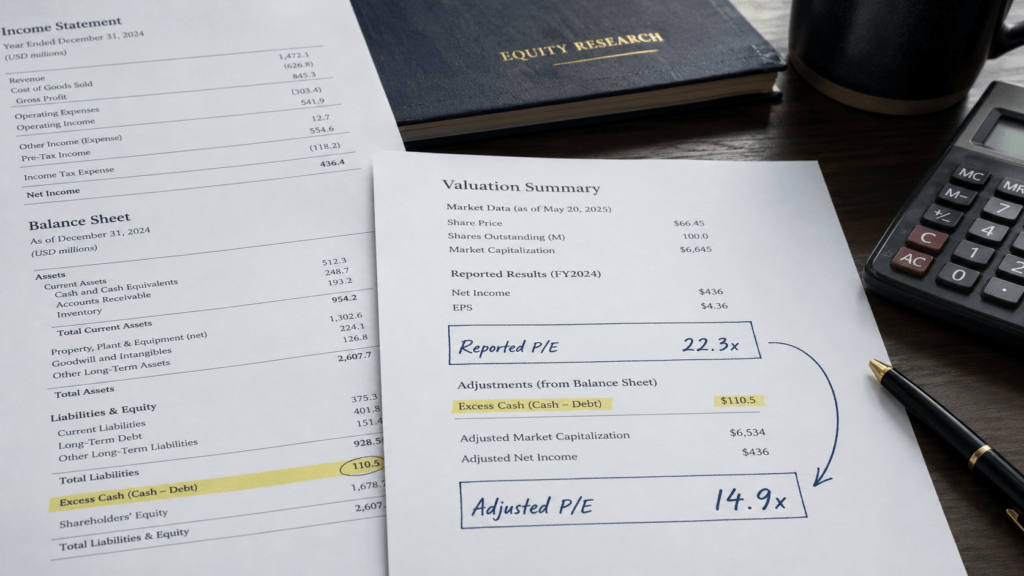
Reported P/E can mislead when excess cash, unusual earnings, or capital structure distort the comparison. Use the cash-adjusted P/E calculator to test the adjustment, then compare the result with the right valuation multiple.
Adjusted P/E Ratio: When Reported P/E Misleads Read More »
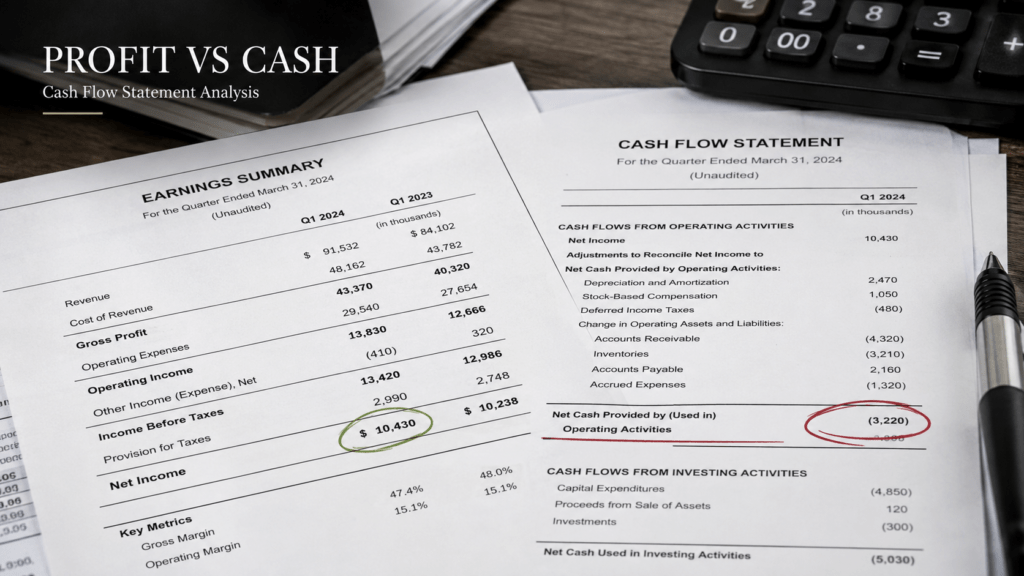
Accrual accounting lets profitable companies hide cash deterioration. Adding one cash flow ratio to screening raises failure prediction from 76.7% to 82.9% — a blind spot that compounds to $264,728 over 30 years. Run the 4-step diagnostic in 18 minutes.
Cash Flow Statement Analysis: How to Read Profit vs. Cash Read More »
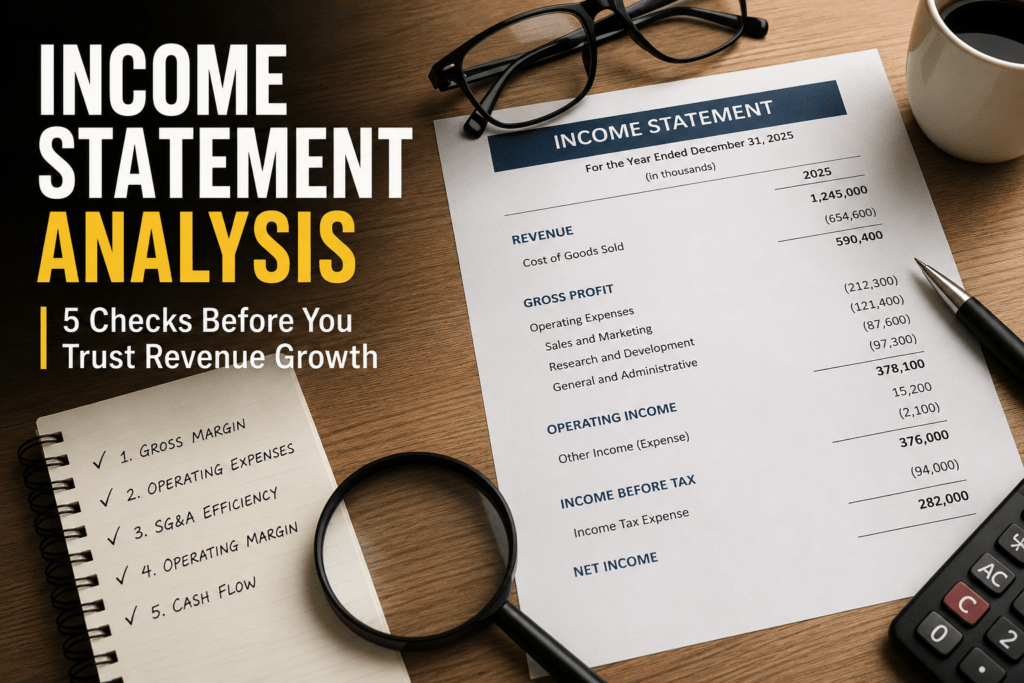
SG&A rises 0.55% per 1% sales increase — but falls only 0.35% per 1% decrease. The 0.20pp asymmetry compounds one revenue miss into a $100,340 gap over 30 years. Five signals catch it before the headline resolves.
Income Statement Analysis: 5 Checks Before You Trust Revenue Growth Read More »