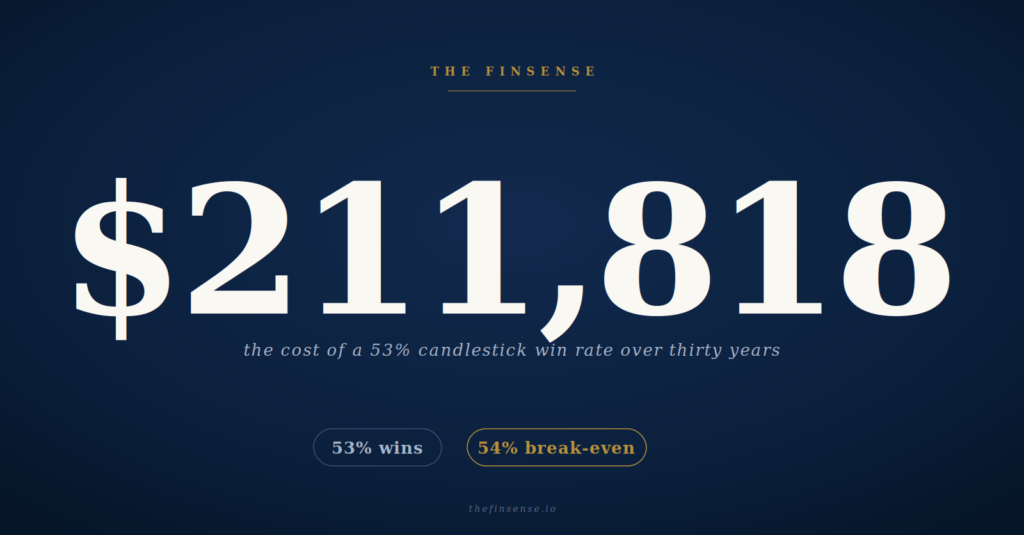
Candlestick Patterns: 53% Wins, 54% Break-Even, $211K Gap
A 53% candlestick win rate still loses money once a 0.20% round-trip cost lands on the same line. Break-even sits at 54%.
Candlestick Patterns: 53% Wins, 54% Break-Even, $211K Gap Read More »
Advanced market analysis based on quantitative data and macro strategies.
A 53% candlestick win rate still loses money once a 0.20% round-trip cost lands on the same line. Break-even sits at 54%.
Candlestick Patterns: 53% Wins, 54% Break-Even, $211K Gap Read More »
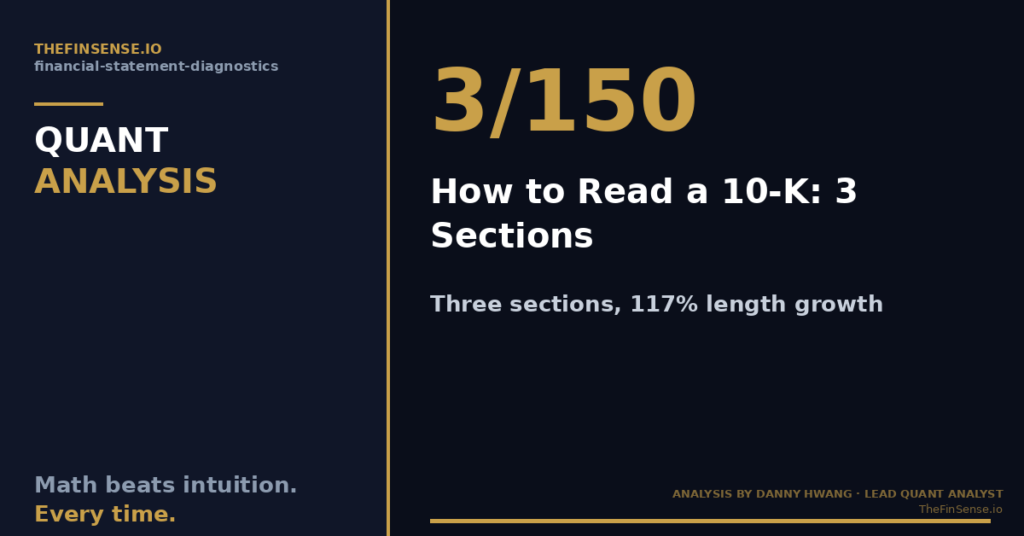
How to read a 10-K starts with three SEC-mandated sections: Item 1A, Item 7, and Item 8. Dyer 2017 showed 3 of 150 topics drove the post-1996 length growth. A 15-minute three-section audit beats a four-hour cover-to-cover read for most annual filings.
How to Read a 10-K: 3 Sections That Move 117% of Length Read More »
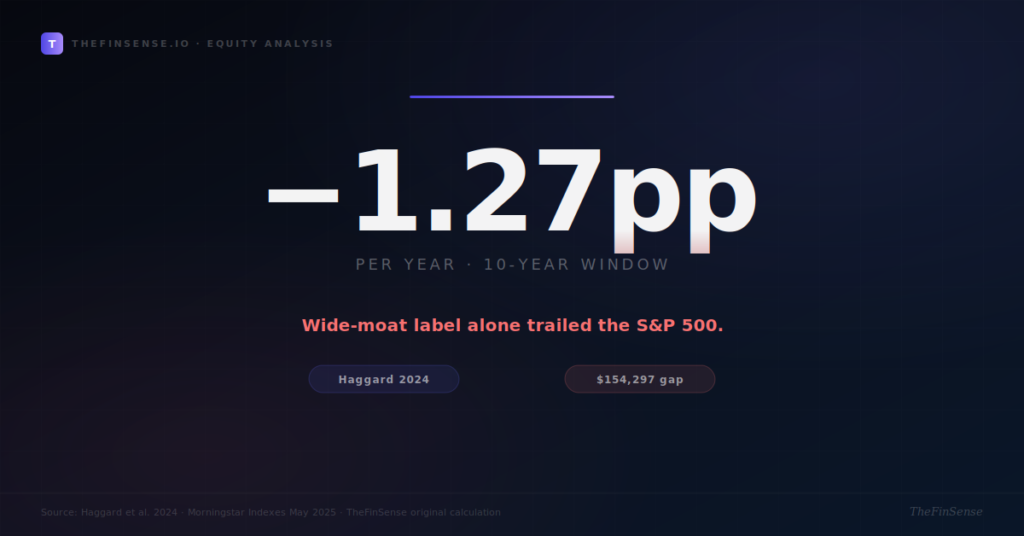
An economic moat label tells you a company can defend its returns; it does not tell you what you should pay to buy them. Morningstar’s moat-only index trailed the S&P 500 by 1.27 points annually — the valuation-screened Wide Moat Focus Index beat the broad market by 2.51 points over the same universe.
Economic Moat: The 1.27pp Lag, 2.51pp Edge in 10 Yrs Read More »
EV/EBITDA vs P/E: a 128.7% distortion, a $214,285 30-year gap, benchmarked against a 12.8x median APAC deal multiple.
EV/EBITDA: Why Pros Ignore P/E for Acquisitions 2026 Read More »
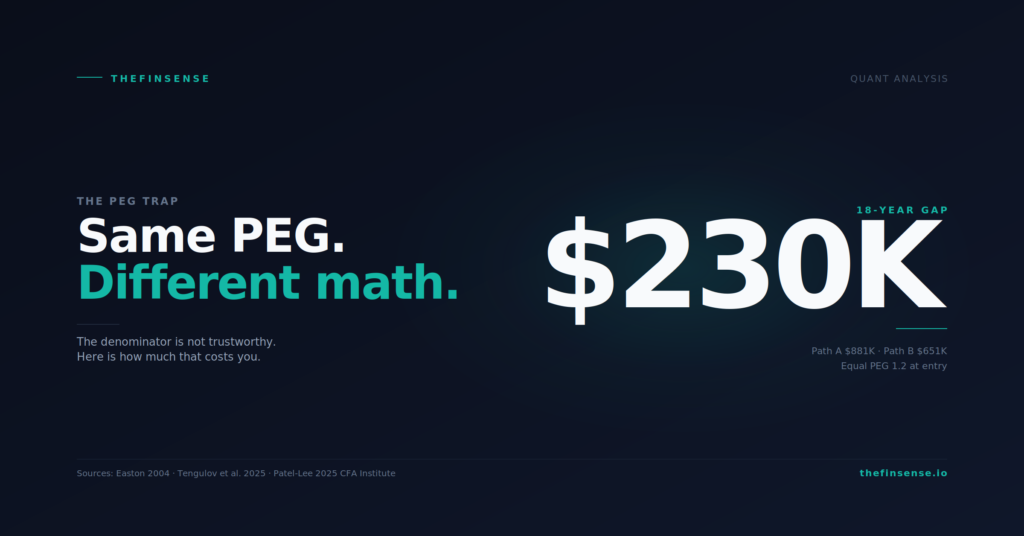
📅 Originally Published: April 21, 2026 · Last Updated: April 21, 2026 · Forensic audit correction applied April 2026 — PEG < 1.0 frequency scope clarified. Same bridge number. Different bridge underneath. The Bottom Line, Up Front Two stocks at the same headline PEG of 1.2 can compound into a $230,000 gap across 18 years
PEG Ratio Formula: Why 1.2 Can Hide $230K (2026) Read More »
The debt-to-equity ratio stops being a comparison tool once shareholders’ equity crosses zero. A three-regime ladder replaces the single-scale reflex.
Debt-to-Equity Ratio: The $0 Equity Line That Breaks D/E Read More »
Buffett’s 15% return on equity threshold sits only 0.56 percentage points above the adjusted ex-financial US market average of 14.44%, per Damodaran’s January 2026 dataset.
Return on Equity: The 0.56% Gap Buffett’s 15% Rule Misses Read More »
Adjusted p/e ratio corrects for cash and debt that fake cheapness. Use our 5-step workflow to close a $214,818 30-year gap on any low-P/E position.
Adjusted P/E Ratio: The 33% Fix Before You Trust It Read More »
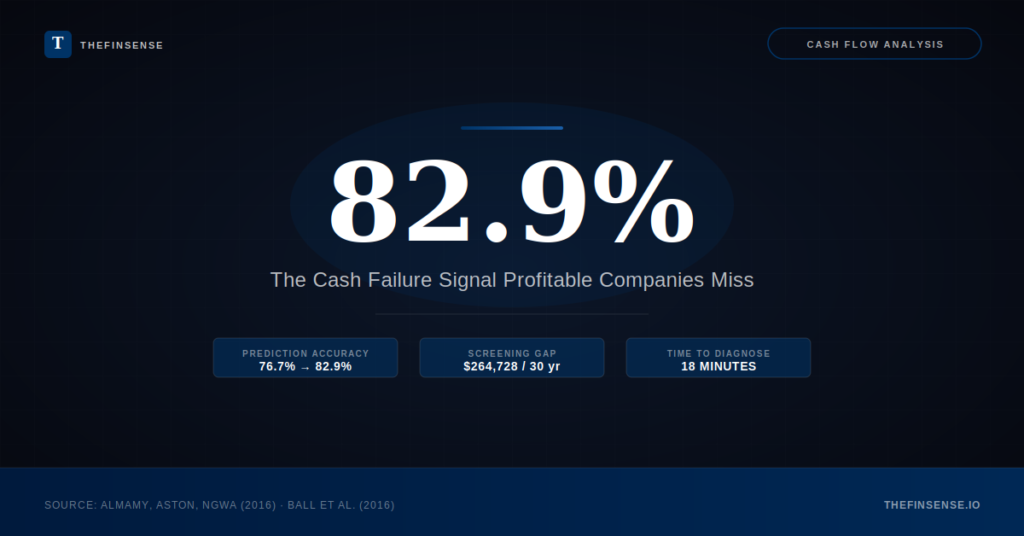
Accrual accounting lets profitable companies hide cash deterioration. Adding one cash flow ratio to screening raises failure prediction from 76.7% to 82.9% — a blind spot that compounds to $264,728 over 30 years. Run the 4-step diagnostic in 18 minutes.
Cash Flow Statement: $264,728 Earnings You Missed Read More »
SG&A rises 0.55% per 1% sales increase — but falls only 0.35% per 1% decrease. The 0.20pp asymmetry compounds one revenue miss into a $100,340 gap over 30 years. Five signals catch it before the headline resolves.
Income Statement Analysis: The $100,340 Trap (2026) Read More »