
📅 Originally Published: · Last Updated:
An economic moat measures how long a company may defend returns above its cost of capital. It does not tell you whether the stock is cheap, whether a moat ETF will beat the market, or whether the advantage will survive every disruption. Use the moat rating as a business-quality screen, then test valuation, company evidence, fund costs, and portfolio fit. Historical performance only becomes useful when the period, benchmark, and return basis match.
A great company can still be a poor investment at the wrong price. That is the practical problem behind economic moat investing.
The moat label helps you test whether a business has an advantage that can last, but it is not a buy signal. Keep three decisions separate: what the rating says about the business, what past returns can actually show, and how the choice changes for a stock, a moat ETF, or a broad-market fund.
What an Economic Moat Actually Measures
Morningstar uses an economic moat to describe a business edge that can last. A wide-moat rating means its analysts expect the advantage to support excess returns on capital for at least 20 years. A narrow moat implies at least 10 years. No moat means the evidence does not support an advantage lasting that long.
The rating rests on five potential sources of advantage:
| Moat source | What can create the advantage | What to verify | Common failure sign |
|---|---|---|---|
| Switching costs | Customers face meaningful disruption, retraining, data migration, or operational risk when leaving. | Retention, contract renewal, pricing power, and low customer churn. | Customers can switch quickly once a cheaper substitute appears. |
| Network effect | The product becomes more useful as more users, buyers, sellers, or developers join. | User engagement, liquidity, ecosystem depth, and two-sided participation. | Growth adds low-quality users or the network can be copied cheaply. |
| Intangible assets | Brands, patents, licenses, data, or regulatory permissions protect economics. | Brand pricing, legal life, renewal risk, and evidence the asset changes customer behavior. | The brand is famous but has no pricing power, or the patent cliff is near. |
| Cost advantage | Scale, process, location, sourcing, or technology creates structurally lower unit costs. | Gross margins, unit economics, capital intensity, and competitor cost curves. | The cost lead depends on temporary input prices or underinvestment. |
| Efficient scale | A limited market supports only a small number of profitable competitors. | Market size, required capital, local density, regulation, and entrant economics. | A larger market or new technology makes entry attractive. |
Plain English
A moat is a claim about the business, not a promise about the stock. The company may keep earning attractive returns while investors earn weak returns because the purchase price was too high.
The distinction matters because stock returns begin with the price you pay. A company can deserve a wide-moat rating and still leave little room for error. The reverse is also possible. A business with a less durable advantage may still produce a strong investment result if the market price already reflects its weaknesses.
What the Performance Evidence Really Shows
Past returns do not tell one clean story. Commonly quoted figures cover different funds, dates, benchmarks, and return types. Mixing them can make the evidence look stronger than it is.
| Source and measurement date | Result shown | What it can support | What it cannot support |
|---|---|---|---|
| Morningstar article updated June 2, 2025; source data as of May 30, 2025 | Wide Moat Focus Index: 11.50% annualized since 2007 inception versus 8.99% for the Morningstar US Market Index. | The valuation-screened index outperformed that benchmark over that dated window. | Proof that valuation screening caused the entire difference or that the same edge will persist. |
| VanEck quarter-end snapshot, June 30, 2026 | Wide Moat Focus Index: 14.32% annualized over 10 years versus 15.51% for the S&P 500. Since April 24, 2012: 14.22% versus 14.79%. | A dated, issuer-published total-return comparison for the displayed periods. | A permanent ranking. The result changes with the window, and the index methodology changed in 2016. |
A quoted moat gap is often not a fair comparison. Morningstar uses PR for price return, which does not reinvest dividends, and TR for total return, which does. If the return bases differ, the gap no longer shows a clean moat win or loss.
The same warning applies when results from different moat indexes or dates are treated as one long record. The index rules, benchmarks, and time periods can differ. Comparing them can raise a useful valuation question, but it cannot prove one exact valuation effect.
So the evidence supports a narrower claim: moat ratings can help separate firms with lasting edges from weaker firms, but returns still depend on what you buy, how you weight it, what it costs, and when you start measuring.
The Economic Moat Decision Router
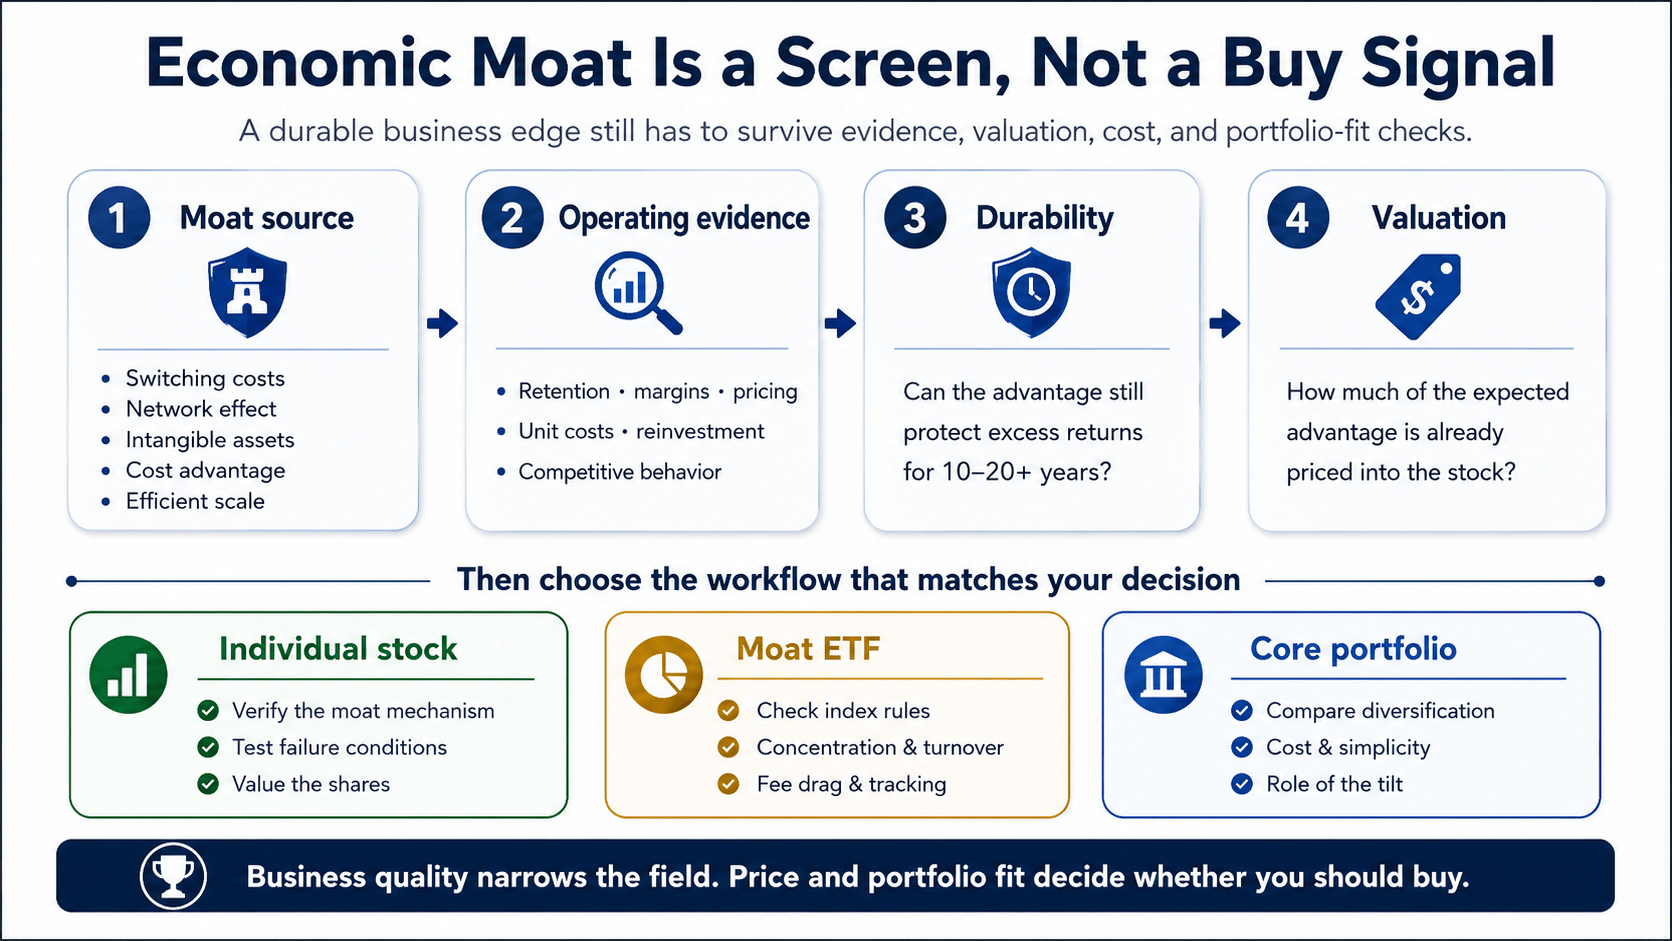
How you use an economic moat depends on the choice in front of you. A stock buyer, an ETF buyer, and a hands-off index investor should not use the same checklist.
| Your decision | Start with | Then verify | Stop if |
|---|---|---|---|
| Buying one company | The specific moat source and how it protects returns on capital. | Financial statements, competitive evidence, valuation, uncertainty, and position size. | The thesis depends on a label, one ratio, or a story that cannot be tied to operating evidence. |
| Buying a moat ETF | The index rule, valuation screen, reconstitution schedule, and benchmark. | Expense ratio, concentration, turnover, tracking difference, and methodology changes. | You are treating past outperformance as a stable premium or ignoring the portfolio’s active factor bets. |
| Choosing a core portfolio | Your need for diversification, simplicity, tax efficiency, and low cost. | Whether a moat tilt adds a role that a broad-market fund does not already fill. | The tilt replaces diversification without a clear reason, or the added complexity will not be maintained. |
Route 1: You are analyzing an individual stock
Begin with the source of the edge. Name the customer behavior, cost structure, legal asset, network, or market limit that creates it. Then look for proof in the accounts and business data. The income statement can show whether pricing power or cost advantage appears in margins, but the trend still needs peer and cycle context.
Next, ask what could break the mechanism. A switching-cost thesis can weaken if open standards make moving easier, while a network effect can weaken if users split activity across platforms. Patents expire, and efficient scale can fade if new tech makes the market easier to enter.
Only after that work should valuation enter. A strong moat can justify a longer period of excess returns in a valuation model, but that also raises the cost of being wrong. Small changes in growth, margins, reinvestment, or the fade period can move fair value a great deal.
Route 2: You are considering a moat ETF
You are buying an index construction process, not a moat rating in isolation. The Morningstar Wide Moat Focus Index combines moat ratings with valuation and portfolio rules. The VanEck MOAT ETF seeks to replicate that index’s performance before fees and expenses.
That creates several layers between the idea and your return:
- Morningstar analysts must find the moat and update the rating as conditions change.
- Fair-value estimates must rank stocks well enough for the screen to work.
- Index rules then set the holdings, weights, turnover, and review schedule.
- The ETF adds its own fund costs, trading frictions, taxes, and tracking difference.
- Your entry date still decides which performance window you actually experience.
VanEck notes a material index methodology change effective June 20, 2016. That does not make the strategy good or bad, but it does mean the full return history should not be read as one unchanging process.
The fund’s current fee is disclosed, while future outperformance is not knowable in advance. That makes cost part of the case for or against a moat ETF.
Moat ETF Fee Drag Check
Estimate how an annual fund fee can change long-run value when the gross return assumption stays the same.
Before adding a tilt, compare its role with your broader asset allocation strategy. A focused quality-value sleeve can be reasonable, but it does not replace a broad core by default. If cost discipline is part of the reason you hold index funds, then the expense ratio impact belongs in the moat-ETF decision.
Route 3: You want a simple core holding
A broad-market fund may be the cleaner answer when you do not want to track analyst ratings, fair-value estimates, index changes, or factor cycles. That choice does not deny that moats exist. The market portfolio already owns many dominant firms, so the moat screen does not have to carry the whole allocation.
For a core holding, the tilt has to earn its extra cost and work through a clear expected benefit or a reason you can stick with it.
How to Verify a Moat at the Company Level
A moat claim becomes useful when it passes four tests that turn the story into proof you can check again later.
- Identify the source of advantage. Do not accept “strong brand” or “market leader” as the end of the analysis. Explain why the edge changes customer or rival behavior. A famous brand without pricing power may be an asset, but it is not automatically a moat.
- Connect the story to operating evidence. Look for proof that fits the moat: retention for switching costs, margins for network effects, unit costs for scale, or licensing barriers for intangible assets. The numbers should support the story, not replace it. Return on equity can help describe business results, but it can also be lifted by leverage, buybacks, or a shrinking equity base. Use the return on equity framework to separate business quality from denominator effects.
- Test the reinvestment path. A business creates more value when it can reinvest at attractive returns on new capital. Historical margins alone do not tell you whether the next dollar of capital will earn the same return. Watch the room to grow, rival responses, deal choices, and how much capital the business needs.
- Write the failure conditions before buying. State what evidence would weaken the thesis. Examples include lasting churn, weaker pricing, falling returns on new capital, rule changes, a new sales model, or too much reliance on a few customers. This step turns “I like the company” into a testable investment case.
A moat thesis should contain a verb. Customers stay, costs fall, users attract users, licenses block entry, or local density deters competitors. If the thesis is only an adjective, it is probably too vague to monitor.
How Valuation Changes the Decision
Valuation is not a final box to tick after finding a good company. It tells you how much of the expected edge is already in the price.
A price-to-fair-value ratio below 1.0 means the market price is below an analyst’s fair-value estimate. It does not prove the stock is cheap. Fair value depends on forecasts for revenue, margins, reinvestment, risk, and the duration of excess returns. A moat rating can influence several of those assumptions, which makes the risk of a bad estimate especially important.
Use a margin of safety that reflects how unsure you are rather than one cutoff for every company. A stable, transparent business may justify a narrower discount. A company facing tech risk, rule changes, reliance on a few customers, or a hard-to-model reinvestment plan may need a wider one.
Multiples can provide a second lens, but they need cleaner inputs. An adjusted P/E ratio can help when reported earnings contain unusual items, and a revenue multiple can move without the business moving. Still, no multiple can replace a view on how long the edge may last and whether new capital can earn good returns.
For an ETF, valuation works differently. The investor cannot negotiate the index’s fair-value assumptions or the timing of reconstitution. The practical checks are the index rules, current holdings, fee drag, concentration, turnover, and how the tilt fits the rest of the portfolio.
Decision Rule
A moat asks whether the business edge may last. Valuation asks how much of that edge is already priced in. Portfolio design decides how much of the remaining risk you can carry.
Economic Moat FAQ
What is an economic moat?
An economic moat is a durable competitive advantage that may allow a company to earn returns above its cost of capital. Morningstar rates companies wide moat, narrow moat, or no moat based on how long that edge may last.
What are the five sources of an economic moat?
Morningstar identifies switching costs, network effects, intangible assets, cost advantages, and efficient scale. A company may have more than one source, but each one still needs business and rival evidence.
Do wide-moat stocks beat the market?
Wide-moat stocks do not beat the market reliably in every period. Historical results change with the index, benchmark, return basis, start date, valuation rule, weighting method, and cost structure. A moat is better treated as a quality screen than as a promise to beat the market.
Does a price-to-fair-value ratio below 1.0 make a stock a buy?
No. It means the market price is below one analyst estimate. The estimate can be wrong, and the margin of safety should reflect how unsure you are about the business and its value. Review the assumptions, not only the ratio.
Is a moat ETF a substitute for an S&P 500 fund?
Not by default. A moat ETF adds analyst ratings, valuation, concentration, turnover, index-rule, and fee risks. It may work as a deliberate tilt, but replacing a broad-market core requires a clear portfolio reason.
Bottom Line: An Economic Moat Is a Screen, Not a Verdict
A moat rating can improve the quality of the companies you study without improving the price you pay for them. For a stock, the next questions are valuation and what could break the advantage. For an ETF, add the index rules, benchmark, fees, concentration, and portfolio fit.
A durable business can protect its profits without protecting an investor from overpaying.
YOUR TURN
For the company or fund you are considering, which point matters more right now: moat durability, valuation, or implementation cost?
- Morningstar, Economic Moat Ratings: How to Measure a Company’s Competitive Advantage, published March 11, 2026. Used for the five moat sources, rating horizons, and the role of valuation in the framework. Primary methodology page.
- Morningstar, Advisors, Here’s How the Morningstar Wide Moat Focus Index Has Performed, updated June 2, 2025, with source data as of May 30, 2025. Used only as a dated inception-to-May-2025 snapshot against the Morningstar US Market Index. Index analysis.
- VanEck Morningstar Wide Moat ETF issuer page, accessed August 20, 2026. Used for the fund inception date, the quarter-end performance table displayed as of June 30, 2026, and the 2016 index-methodology change. Issuer page.
- Morningstar Index return-basis definitions. Used to distinguish price return, which excludes dividend reinvestment, from total return, which includes reinvested dividends. Return-basis definitions.
AI use disclosure. AI tools assisted with source organization, calculation checks, and copyediting. The cited Morningstar and VanEck materials and the calculator assumptions were checked during editing; AI did not supply an uncited performance figure or investment recommendation.
Update history
-
v1.2
2026-08-20
FACT_REPAIRRemoved an adjusted-premium claim that could not be confirmed from the final paper, clarified dated performance comparisons and return-basis limits, fixed internal links, added a compact fee-drag calculator, and refreshed the article trust package.
-
v1.1
2026-07-19
SUBSTANTIVE_UPDATERebuilt the article after identifying a price-return versus total-return mismatch in the original hero claim. Removed the fixed-drag calculator and dollar projections, added dated issuer data, and restructured the article around a decision-router framework.
-
v1.0
2026-04-25
PUBLISHOriginal publication.