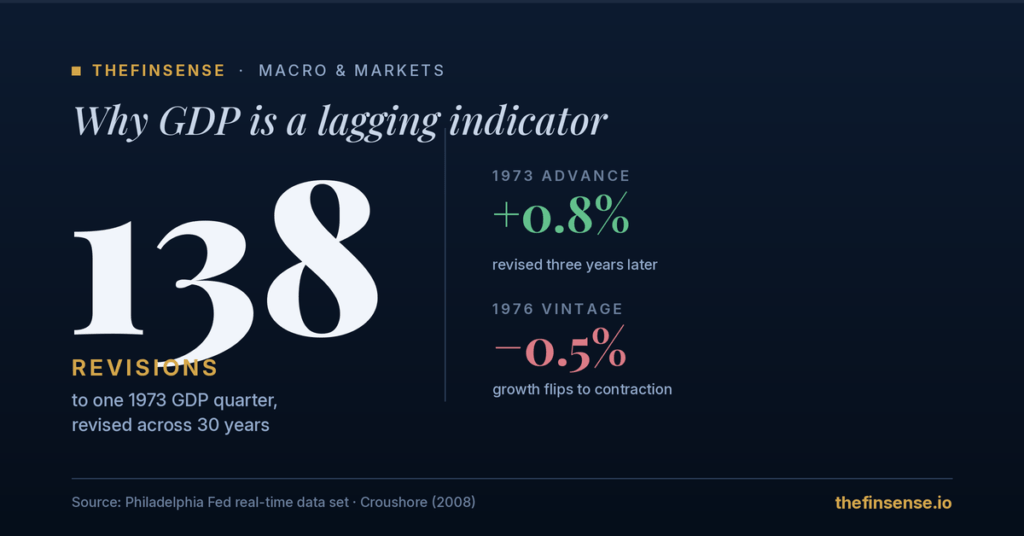
Trendline Survivorship Bias Drains $598K in 35y
Retail trendline trading looks free but compounds 1% drag into a $598,099 wealth gap on $200K over 35 years. The chart never shows what it deleted.
Round-number support and resistance attract 3.73x more trades than uniform distribution would predict at integer prices like $100. Bhattacharya, Holden and Jacobsen estimated -$813 million in annual aggregate wealth transfer.
Support and Resistance: The 3.73x Round-Number Trap Read More »
A 53% candlestick win rate still loses money once a 0.20% round-trip cost lands on the same line. Break-even sits at 54%.
Candlestick Patterns: 53% Wins, 54% Break-Even, $211K Gap Read More »
Technical analysis works only when a backtested rule survives data-snooping correction, realistic transaction costs, and out-of-sample testing.
Technical Analysis Works Only Under 3 Conditions Read More »
How to read a 10-K starts with three SEC-mandated sections: Item 1A, Item 7, and Item 8. Dyer 2017 showed 3 of 150 topics drove the post-1996 length growth. A 15-minute three-section audit beats a four-hour cover-to-cover read for most annual filings.
How to Read a 10-K: 3 Sections That Move 117% of Length Read More »
Acquiring-firm shareholders lost 12 cents per dollar deployed across the 1998-2001 merger wave, totaling $240 billion in destroyed wealth per Moeller, Schlingemann, and Stulz (2005).
An economic moat label tells you a company can defend its returns; it does not tell you what you should pay to buy them. Morningstar’s moat-only index trailed the S&P 500 by 1.27 points annually — the valuation-screened Wide Moat Focus Index beat the broad market by 2.51 points over the same universe.
Economic Moat: The 1.27pp Lag, 2.51pp Edge in 10 Yrs Read More »
EV/EBITDA vs P/E: a 128.7% distortion, a $214,285 30-year gap, benchmarked against a 12.8x median APAC deal multiple.
EV/EBITDA: Why Pros Ignore P/E for Acquisitions 2026 Read More »
📅 Originally Published: April 21, 2026 · Last Updated: April 21, 2026 · Forensic audit correction applied April 2026 — PEG < 1.0 frequency scope clarified. Same bridge number. Different bridge underneath. The Bottom Line, Up Front Two stocks at the same headline PEG of 1.2 can compound into a $230,000 gap across 18 years
PEG Ratio Formula: Why 1.2 Can Hide $230K (2026) Read More »
27 S&P 500 Firms Report Negative Book Equity: Q1 2026 Analysis By Danny Hwang, Lead Quant Analyst, TheFinSense Published: April 20, 2026 · Updated: April 21, 2026 Quick Answer. 27 of 396 S&P 500 non-financial constituents (6.8%) report negative stockholders’ equity on their latest 10-Q or 10-K. Consumer Discretionary alone contributes 11 of them, primarily
27 S&P 500 Firms Report Negative Book Equity: Q1 2026 Analysis Read More »