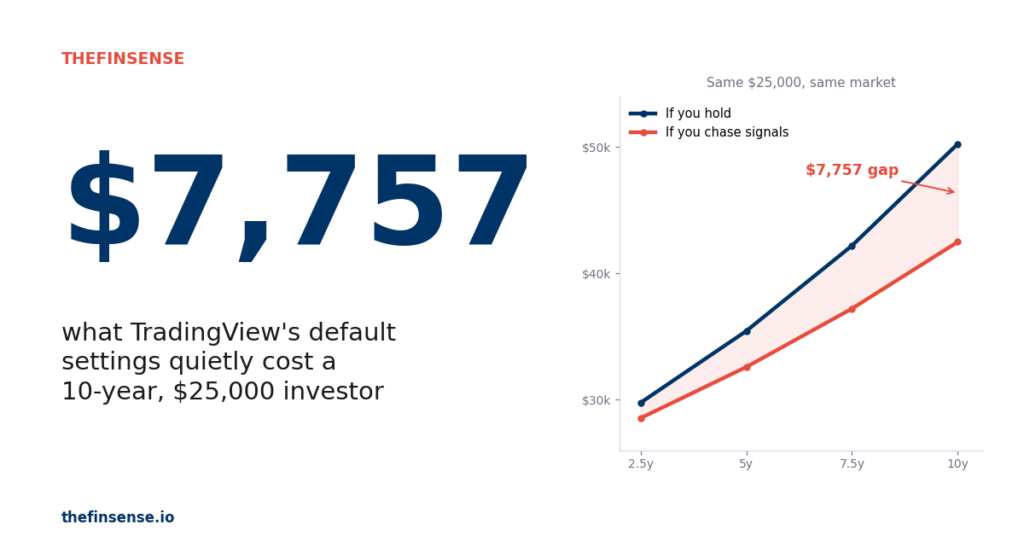
Trading Edge

TheFinSense’s Trading Edge series debunks retail trading-rule lore with cost-adjusted expected value math. Each article tests a popular technical signal — moving average crossovers, golden cross, candlestick patterns, support and resistance, trendline survivorship — against academic literature (Brock-Lakonishok-LeBaron 1992, Bajgrowicz-Scaillet 2012, Sermpinis 2019, Barber-Odean 2000) and three-regime cost models. Result: most “edges” lose to passive buy-and-hold once round-trip costs, turnover frequency, and tax friction compound over 25-35 years. Math beats intuition. Every time.

Volume precedes price: $1,241,031 35-year compound cost on $120K from acting on the unsourced 73% claim

Volume Precedes Price: The Myth 3 Journals Demolish

The ‘volume precedes price 73 percent of the time’ claim has no peer-reviewed academic source. Four major academic papers from 1987 through 2009 contain zero quantification of the specific hit-rate. Lee and Swaminathan’s data shows the high-volume winners retail traders chase reverse fastest over the following years. Acting on the unverified signal costs $1,241,031 over

Volume Precedes Price: The Myth 3 Journals Demolish Read More »

RSI overbought signal 47% TSX hit rate falsified across 5 OECD markets per Chong-Ng-Liew 2014

RSI Overbought Signal: Right Only 47% of the Time

Why trust this analysis Danny Hwang; aggregated 5-market RSI 70/30 trading-rule profitability Tables from Chong-Ng-Liew JRFM 2014. Hit rates verified against published Brock-Lakonishok-LeBaron t-statistics; 4-year crypto cross-asset confirmation; methodology open. Sources verified May 2026; corrections logged within 24 hours. 📅 Originally Published: May 12, 2026 Last Updated: May 13, 2026 Editorial transparency: This article was

RSI Overbought Signal: Right Only 47% of the Time Read More »