
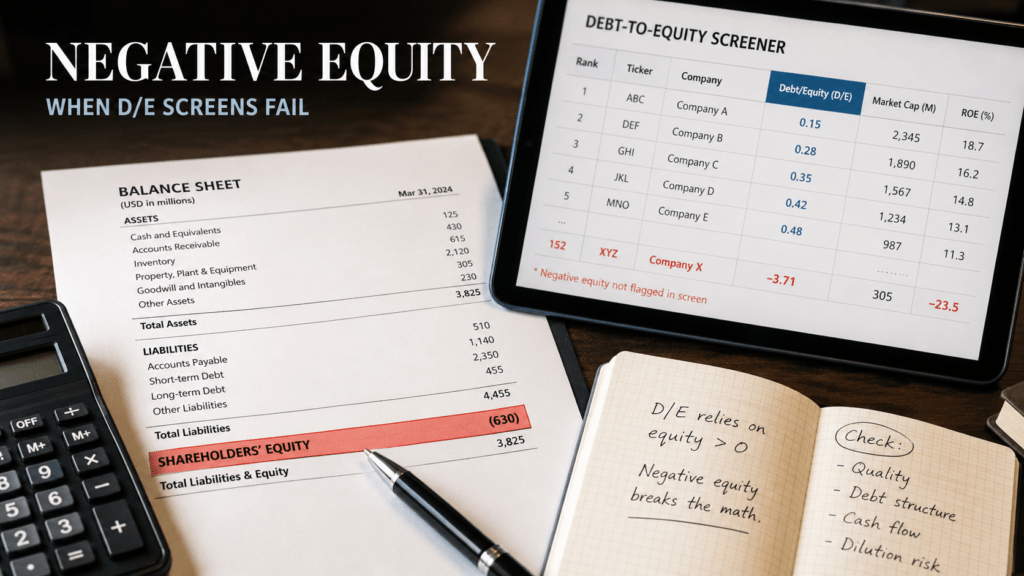
Negative book equity appeared in 27 of 396 S&P 500 non-financial companies in TheFinSense’s April 2026 working paper. The study uses three E/A regimes to show when a normal D/E screen stops being comparable. Equity at zero makes D/E undefined; equity below zero makes D/E negative but unsuitable for normal peer ranking. This companion explains the finding, tests it against HCA Healthcare (HCA), and lets you apply the study rule to one filing.
Why Negative Book Equity Breaks a D/E Screen
The paper starts with the denominator because negative book equity can make a negative D/E look deceptively low. The sign flips when stockholders’ equity falls below zero, so the ranking no longer means what a normal positive D/E ranking means. That shift is the core screening problem examined in this study.
The site’s main D/E guide covers formula choices and normal peer comparison. This companion has a narrower job. It explains the paper’s equity-base finding and the three regimes. It then shows why Regime 3 needs filing-level follow-up instead of a simple leverage rank.
The math rule behind the study: D/E has no defined value when equity equals zero. With negative equity, the division still gives a number, but that negative result should not be compared with a normal positive leverage multiple.
What the 396-Company Study Found About Negative Book Equity
The April 2026 working paper classified S&P 500 non-financial companies by stockholders’ equity divided by total assets, or E/A. It used each company’s latest available 10-Q or 10-K at the research date. The final sample covered 97% of the eligible universe, and the median filing period-end was December 31, 2025.
| Regime | E/A condition | Companies | How to treat D/E |
|---|---|---|---|
| 1: Normal | E/A > 0.20 | 323 (81.6%) | Usable with matched debt definitions and peer context |
| 2: Thin | 0 < E/A ≤ 0.20 | 46 (11.6%) | Calculable, but sensitive to denominator changes |
| 3: Non-comparable | E ≤ 0 | 27 (6.8%) | Zero is undefined; negative output should not be peer-ranked |
Most of the sample stayed in Regime 1: 323 companies, or 81.6%. Another 46 companies had positive but relatively thin equity bases and fell into Regime 2. The remaining 27 companies, 6.8% of the sample, had zero or negative stockholders’ equity and were routed to Regime 3.
The 20% E/A line between Regimes 1 and 2 is a study rule, not a broad accounting cutoff. It flags a thin but still positive equity base, while the zero boundary has a different job. At zero equity, D/E has no defined value; below zero, it turns negative and should no longer be compared with normal positive ratios.
The tool below applies the same study rule to one company. It does not rebuild the paper’s full data set or act as a solvency model. That makes the tool a check on the rule, not a new model. Readers still need the filing to explain why the balance moved.
Apply the Study’s 3-Regime Rule
Enter one company’s filing values from the same date and unit. The tool applies the paper’s E/A rule and shows what that regime means for D/E.
⚠️ How to use this study companion:
- Study rule only: it applies the April 2026 E/A regimes to one company; it does not rebuild the paper’s full sample.
- 20% belongs to this study: the Regime 1/2 line is a research rule, not a broad accounting or solvency threshold.
- Use one basis: equity, assets, and debt must come from the same entity, reporting date, and units.
- Debt definition matters: this tool uses borrowings that charge interest for D/E; a provider using total liabilities will show a different ratio.
- Sector limits matter: the study excludes Financials and Real Estate; do not transfer its thresholds mechanically to those capital structures.
- Not a solvency score: cash flow, liquidity, interest coverage, covenants, and maturities still need separate review.
The same denominator issue can distort return on equity. A high or negative ROE may say more about a thin book equity base than about business quality.
What Pushed Some Companies into Regime 3
The study found 11 Consumer Discretionary companies in Regime 3. That was about 41% of the 27 companies with negative book equity. By comparison, the sector was roughly 12% of the non-financial study universe. The group included AutoZone, Booking Holdings, Domino’s, Hilton, Lowe’s, Marriott, McDonald’s, O’Reilly Automotive, Starbucks, Wynn Resorts, and Yum! Brands.
That concentration does not prove one cause. Mature companies can return more capital through buybacks and dividends than they retain in book earnings. Treasury stock and past cash payouts can then pull common equity below zero while the business stays profitable.
Other paths are less benign because repeated losses can erode retained earnings, while write-downs can shrink both assets and equity. Debt-funded payouts can add leverage at the same time, and pension or currency changes can also move other comprehensive income and, in turn, equity.
| Possible mechanism | What to inspect | What raises concern |
|---|---|---|
| Buybacks or dividends | Treasury stock, retained earnings, free cash flow, new debt | Borrowing rises while coverage weakens |
| Operating losses | Retained deficit, operating margin, operating cash flow | Losses persist without improving cash generation |
| Leverage buildup | Debt, interest expense, liquidity, maturity schedule | Near-term refinancing pressure or falling coverage |
| Write-downs | Goodwill, impairments, acquisition accounting | Asset values fall while fixed claims remain |
The practical question is not just whether equity is negative. Ask what moved equity below zero and how long the trend has lasted. Then ask whether the company can pay its debts from cash it earns without relying on favorable refinancing terms.
HCA Healthcare: Why Regime 3 Is Not a Distress Label
HCA Healthcare is a useful counterexample to any simple “negative equity means buybacks” story. SEC filings show a stockholders’ deficit attributable to HCA Healthcare of about $0.93 billion at December 31, 2021. The same balance was about $6.03 billion below zero at December 31, 2025. The 2026 filing also shows large share buybacks during 2025.
Those facts do not support a one-line distress verdict or a one-line buyback verdict. Both the cause and the trend matter when the equity balance keeps moving farther below zero. The reported equity cushion became much more negative over the period, while capital returns also affected the equity account.
Do not convert negative book equity into a bankruptcy probability. Review debt maturity dates, interest coverage, cash flow, liquidity, covenant terms, and the direction of the deficit. D/E no longer answers that credit question cleanly.
The operating side provides a useful cross-check. The income statement guide shows how margins and profit can be checked beside cash flow instead of relying on one balance sheet ratio.
What This Study Does Not Claim
Cathcart, Dufour, Rossi, and Varotto studied about six million firm-year observations from six European countries between 2005 and 2015. They found a 1.24 percentage-point gap in predicted annual default probability between the highest and lowest leverage quartiles for large firms. The reported gap for small and medium-sized firms was 2.87 percentage points.
The large-firm result is the closer reference for an S&P 500 discussion, but it is still only context. It should not be pasted onto a U.S. company as a ready-made risk estimate. The study used European firms, an earlier period, and a different model. It did not estimate default risk for the companies on this page. The three-regime framework also does not give a default probability for one company.
TheFinSense documents the SEC filing method and permanent paper record on the study page. The supporting company-level data are available on request rather than embedded here. Read the counts as a dated research result, not as a live screen rebuilt on this page today.
How to Use the Finding in a Real Screen
The paper’s finding works best as a rule for handling a screen, not as a buy-or-sell signal. If a company lands in Regime 2 or Regime 3, use the regime to decide what evidence to open next.
Start with these checks:
- Confirm the equity regime: Check stockholders’ equity and total assets from the same filing date before trusting the D/E rank.
- Reconcile the equity balance: Review retained earnings or deficit, treasury stock, other comprehensive income, and major write-downs.
- Separate capital returns from deterioration: Compare buybacks and dividends with free cash flow, operating results, and new borrowing.
- Move to debt service: Review net debt, interest coverage, liquidity, covenants, and the maturity schedule.
- Keep the research limit clear: The regime tells you how to handle the screener output. It does not give a credit rating or expected return for one company.
That is the practical use of the working paper. Negative book equity does not answer whether a stock is safe or risky. Regime 3 tells you the usual D/E rank has stopped answering the question, so the filing now matters more than the screener column.
Frequently Asked Questions
Is negative book equity the same as insolvency?
No. Negative book equity is an accounting condition, and the same balance can appear in firms with very different cash flow and debt profiles. A firm can fail even when book equity is positive. It can also keep paying its debts when book equity is negative. Cash flow, liquidity, debt maturities, covenants, and asset quality are needed for that assessment.
Is a negative D/E ratio undefined?
No. It is undefined when equity equals zero. When equity is negative, the division still gives a negative number, but that result should not be ranked against normal positive D/E ratios.
Why were Financials and Real Estate excluded?
Banks use regulatory capital rules that differ from the book equity used for most operating companies. REIT balance sheets are also shaped by property accounting and payout rules. Using one E/A rule would mix very different capital structures.
Why is this an April 2026 snapshot?
The study was compiled on April 20, 2026 from the latest filing available for each company. Most observations came from FY2025 10-Ks, and the median filing period-end was December 31, 2025. “Q1 2026” describes the research timing, not a claim that every company had filed first-quarter results.
Where are the company-level data?
The working paper documents the SEC filing aggregation and related files. Supporting CSV files are available through TheFinSense on request. The permanent paper record is linked in the evidence section below.
One question to take from the study
If a company lands in Regime 3, can you explain which balance-sheet entries pushed equity to zero or below? If not, the classification has done its job: it has shown you where the deeper analysis needs to begin.
- TheFinSense working paper: April 20, 2026 snapshot of 396 S&P 500 non-financial companies using the latest available 10-Q or 10-K, with 323 companies in Regime 1, 46 in Regime 2, and 27 in Regime 3. Permanent DOI and paper record.
- HCA Healthcare: SEC filings report a $0.933 billion stockholders’ deficit attributable to HCA at December 31, 2021 and a $6.027 billion deficit at December 31, 2025. 2022 Form 10-Q with FY2021 comparative balance; 2026 Form 10-Q with FY2025 comparative balance.
- Cathcart et al. (2020): six-country European sample, 2005–2015, with predicted annual default-probability gaps of 1.24 percentage points for large firms and 2.87 points for SMEs across leverage quartiles. Journal of Corporate Finance article.
Limits: This is a dated filing snapshot, not a live constituent screen. Negative book equity does not prove distress, safety, or future returns. The Cathcart estimates are cross-sample context, not S&P 500 company-level default estimates.
Broader calculation and sourcing standards: TheFinSense methodology.
AI disclosure: Automated tools assisted with source retrieval, arithmetic checks, formatting, and editorial review. Danny Hwang reviewed the source selection, calculations, limitations, and final wording.
Update history
-
v1.2
2026-08-19
REMEDIATIONRefocused the page around the April 2026 working paper, surfaced the permanent study record beside the core findings, kept the interactive tool subordinate to the research, aligned D/E terms with the canonical guide, and clarified the study limits and filing-level next steps.
-
v1.1
2026-07-18
CORRECTIONCorrected the mathematical treatment of negative-equity D/E, removed the unreproducible rate-side detour, narrowed the Cathcart comparison, and updated the author and evidence package.
-
v1.0
2026-04-20
PUBLISHOriginal publication of the companion analysis to the Q1 2026 Balance Sheet Stress Report.