
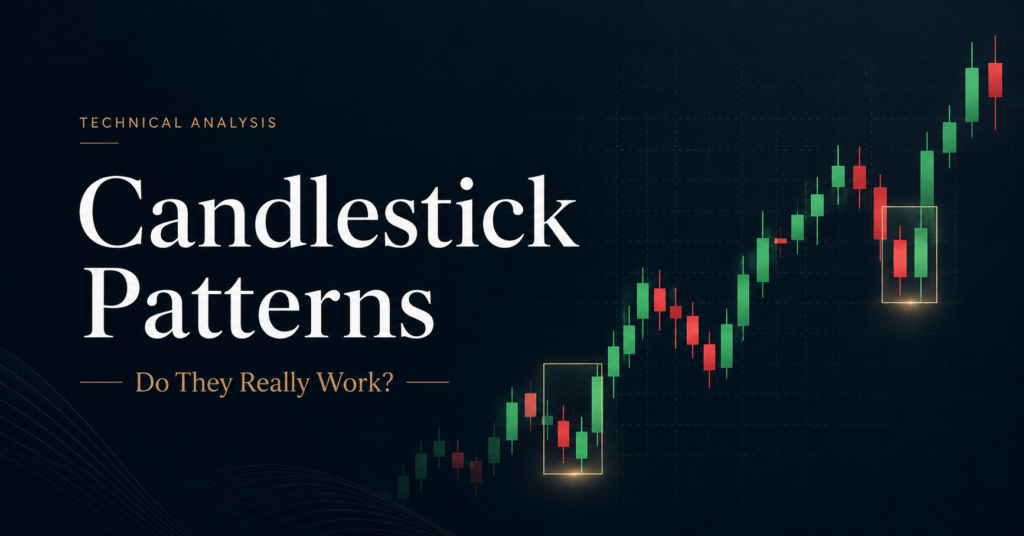
Candlestick patterns can describe a price reversal without proving a profitable trade. Bulkowski reports that the bullish kicking pattern reversed the prior trend 53% of the time, but that figure is not a strategy win rate. It does not, by itself, specify an entry, exit, stop, average winner, average loser, trading cost, or out-of-sample result.
Profitability starts with expected value: actual win probability × average win, minus loss probability × average loss, minus total trading cost. Treat the pattern name as a hypothesis, then test the complete rule after costs on data that was not used to design it.
The chart looks decisive: a black candle, an upward gap, then a tall white candle. A reversal percentage sits beside it. It is easy to read those two facts as a trade recommendation.
That shortcut skips the most important question. Fifty-three percent of what?
For the bullish kicking pattern, Bulkowski is reporting how often the pattern acted as a bullish reversal of the existing price trend. He is not reporting the percentage of fully specified trades that ended with a profit after spreads, slippage, commissions, stops, and exits. Those are different measurements.
What the 53% Candlestick Statistic Actually Measures
Bulkowski’s bullish kicking page says the pattern acted as a bullish reversal 53% of the time. He also calls that result “near random,” ranks the pattern 100th out of 103 for frequency, and notes that its overall performance rank was 96th out of 103. The best reported average move over ten days was 2.78% in one market and breakout combination.
Primary source: Thomas Bulkowski, Bullish Kicking Candlestick. The page distinguishes tested reversal behavior from post-breakout performance and warns that the pattern was rare.
| The statistic supports | The statistic does not establish |
|---|---|
| The pattern reversed the prior trend in 53% of tested occurrences. | A trader won 53% of completed trades. |
| The bullish interpretation was only slightly more common than the alternative. | The average winning trade exceeded the average losing trade. |
| The named shape can be identified and classified consistently enough to study. | The result survived a specific stop, exit, holding period, and cost model. |
| The pattern was rare relative to the other candle types in the catalog. | The broad 4.7-million-bar dataset produced a large sample of bullish kicking trades. |
This distinction matters because candlestick patterns are usually shown as visual signals, while a tradable strategy is a sequence of rules. A strategy needs a trigger, execution price, risk limit, exit rule, position size, and cost model. Change any one of those and the win rate and payoff distribution can change with it.
The same discipline applies to other technical signals. A golden cross win rate or an SMA versus EMA crossover result only becomes useful after the entry, exit, benchmark, and cost assumptions are visible.
Why Win Rate Alone Cannot Prove Profitability
Once a trade is defined, the next step is expected value. The calculation is simple, but the inputs must come from the same strategy and the same test window.
EV = (p × W) − ((1 − p) × L) − C
- p = actual probability that the defined trade wins
- W = average gain on winning trades
- L = average loss on losing trades, entered as a positive number
- C = total round-trip cost as a percentage of capital committed to the trade
The break-even win probability is p* = (L + C) / (W + L). This model assumes each trade uses a comparable capital base. Taxes, changing position sizes, overnight gaps, and market impact require separate treatment.
Consider a deliberately simplified sensitivity test. Suppose a trader treats the reported reversal rate as the win probability, wins or loses 2.5% on each trade, and pays 0.20% in total round-trip cost. Under those assumptions, the expected value is negative 0.05% per trade, and break-even is 54%.
That result is mathematically correct for those inputs. It is not evidence that the bullish kicking pattern actually has 2.5% winners, 2.5% losers, or 0.20% costs. It is an illustration of how quickly the conclusion changes when payoff and cost assumptions change.
| Scenario | Average win | Average loss | Cost | EV per trade | Break-even win rate |
|---|---|---|---|---|---|
| Equal payoff | 2.50% | 2.50% | 0.20% | −0.05% | 54% |
| Larger average winner | 3.00% | 2.00% | 0.20% | +0.45% | 44% |
| Larger average loser | 2.00% | 3.00% | 0.20% | −0.55% | 64% |
| Equal payoff, lower cost | 2.50% | 2.50% | 0.05% | +0.10% | 51% |
Independent calculation: the equal-payoff row is (0.53 × 0.025) − (0.47 × 0.025) − 0.002 = −0.0005, or −0.05% per trade.
The table shows why a slightly-above-even hit rate has no universal meaning. A strategy can make money with a win rate below 50% when winners are substantially larger than losers. It can lose money with a win rate above 50% when losses or costs are larger.
Costs also need to match the instrument and execution. Commission-free trading does not eliminate the bid-ask spread, slippage, adverse fills, financing charges, or market impact. A realistic technical analysis backtest should apply those costs at the point where the strategy could actually trade.
Why 4.7 Million Bars Can Still Mislead
Bulkowski’s broader research is substantial. In his methodology article, he says he examined more than 4.7 million price bars to identify and track 103 candlestick patterns. That supports the breadth of the catalog.
Primary source: Thomas N. Bulkowski, The Eight Best-Performing Candles, methodology section.
But 4.7 million bars is the search universe across all 103 patterns. It is not the sample size for the bullish kicking pattern. Bulkowski explicitly says bullish kicking was rare and that he published only partial statistics because of the limited number of samples.
This is a common denominator mistake. A large underlying database can still produce a small number of observations for a rare event. The confidence you should place in the pattern-specific result depends on the number of qualifying occurrences, how they were distributed across stocks and market regimes, and whether the same rule worked outside the period used to define it.
Independence matters too. Ten signals from closely related stocks during the same market shock are not equivalent to ten unrelated trials. A cluster of correlated trades can make a backtest look more certain than it is.
The practical rule is straightforward: use the large database as evidence that the test was broad, not as a substitute for the pattern-specific trade count and uncertainty estimate.
What the Research Says About Candlestick Patterns
The academic record is mixed, which is exactly why a named pattern should not be treated as a timeless law.
Caginalp and Laurent tested mathematically defined three-day patterns using daily open, high, low, and close data for S&P 500 stocks from 1992 through 1996. Their out-of-sample results reported strong statistical significance and an average profit of almost 1% over a two-day holding period. That is evidence that tightly defined candlestick patterns can contain information in some samples.
Primary source: G. Caginalp and H. Laurent, The Predictive Power of Price Patterns, Applied Mathematical Finance (1998).
Later results were less encouraging. Tharavanij, Siraprapasiri, and Rajchamaha tested bullish and bearish reversal patterns on the 50 component stocks of Thailand’s SET50 index from July 2006 through June 2016. They examined 1-, 3-, 5-, and 10-day holding periods and two exit methods. Most mean returns were not statistically different from zero, directional prediction was unreliable, and adding %D, RSI, or MFI filters generally did not improve profitability or prediction accuracy.
Primary source: P. Tharavanij, V. Siraprapasiri, and K. Rajchamaha, Profitability of Candlestick Charting Patterns in the Stock Exchange of Thailand, SAGE Open (2017).
| Study feature | Why it changes the result |
|---|---|
| Market and period | Market structure, volatility, and participant behavior differ across countries and decades. |
| Pattern definition | Small changes in trend filters, candle inequalities, or confirmation rules change which events qualify. |
| Entry and exit | Next-close, fixed-day, stop-based, and average-exit methods create different payoff distributions. |
| Costs and execution | A gross statistical pattern may disappear after realistic spreads, slippage, and turnover. |
| Testing discipline | In-sample selection can reward chance. Out-of-sample and walk-forward tests ask whether the edge travels. |
Confirmation indicators deserve the same skepticism. Tharavanij’s result does not prove that RSI or MFI can never help any strategy. It shows that adding familiar overlays did not generally rescue the tested candlestick patterns in that market and design. More indicators can add parameters and increase overfitting instead of adding independent information.
Support, resistance, and trend context may still be useful, but they need explicit definitions. A chart annotation is not a reproducible filter until another researcher can apply the same rule to the same data and obtain the same signals. The same standard applies to support and resistance trading rules.
A Five-Part Audit Before Trading Candlestick Patterns
A candlestick pattern can be a useful observation tool. The audit below determines whether it deserves capital.
1. Define the trade before looking at the result
Write the rule so that two people would generate the same trades. Specify the instrument universe, timeframe, pattern definition, trend filter, signal time, entry price, stop, exit, maximum holding period, and position-sizing rule.
Do not optimize the definition after seeing which version made the most money. Every extra variation creates another chance to select a lucky result.
2. Measure the full payoff distribution
Record the number of trades, win rate, average and median winner, average and median loser, largest loss, time in trade, and exposure. A single average can hide a strategy that wins frequently but occasionally loses much more.
Calculate expected value from the actual trade list. Then compare the strategy with a simple benchmark over the same dates and exposure.
3. Apply costs where the trade occurs
Use the bid or ask side that the strategy could have received, not an ideal midpoint or the signal candle’s closing price when the signal was only known after the close. Include spreads, slippage, commissions, borrowing or financing costs, and taxes when they are relevant to the account.
Run a cost sensitivity range. An edge that survives only at zero cost is not ready for live trading.
4. Separate design data from evaluation data
Keep a genuinely untouched out-of-sample period. For strategies that may change with market conditions, add walk-forward testing across multiple regimes rather than relying on one fixed split.
If you tried many candlestick patterns, trend filters, holding periods, and stop levels, account for that search. The best backtest among hundreds of attempts is usually upward-biased even when each individual test looks reasonable.
5. Check stability before sizing
Break the result down by stock, year, volatility regime, direction, and liquidity. Look for a broad contribution rather than one ticker, one month, or one extreme trade carrying the result.
Only then choose position size. Size should reflect the uncertainty and drawdown of the tested strategy, not the visual confidence of the candle. A setup that cannot survive a small change in cost, entry timing, or sample period has not earned a large allocation.
Frequently Asked Questions
Do candlestick patterns work?
Some tightly defined candlestick patterns have shown predictive or profitable results in specific markets and periods, while other studies found little reliable value. The answer depends on the exact pattern definition, entry and exit rules, costs, market, sample period, and out-of-sample performance. A pattern name alone is not enough.
Is a 53% reversal rate good?
A 53% reversal rate is only slightly above an even split, and it is not automatically a 53% trade win rate. To judge a strategy, you need the pattern-level sample count, exact trade rules, average win, average loss, costs, and out-of-sample results. Under one equal-payoff illustration, 53% can be profitable or unprofitable depending on cost.
What is the break-even win rate for a trading strategy?
With average win W, average loss L, and round-trip cost C, the break-even win rate is (L + C) / (W + L). When wins and losses are both 2.5% and cost is 0.20%, break-even is 54%. Replace those illustrative inputs with the results from your own defined strategy.
Should candlestick patterns be combined with RSI?
RSI may add information in a specific strategy, but it should not be assumed to improve a candle signal. Tharavanij and co-authors found that %D, RSI, and MFI filters generally did not improve profitability or prediction accuracy in their SET50 tests. Test the combined rule independently and penalize the additional parameter search.
How many trades are needed to validate a candlestick strategy?
There is no universal minimum that makes a strategy valid. The required sample depends on the size and variability of the edge, trade dependence, number of rules tested, and intended confidence. Report the exact trade count and uncertainty, then require the result to persist across out-of-sample periods and market regimes.
Bottom Line
Candlestick patterns compress price behavior into a visual label, but the label does not include the rules that make a trading system testable.
Bulkowski’s bullish kicking result says that a rare pattern reversed the prior trend slightly more often than it did not. It does not supply the trade definition or payoff data needed to claim a profitable edge. The broader 4.7-million-bar research base shows that many patterns were examined, but it does not replace the sample size and uncertainty for one rare setup.
Before trading any candle signal, define the rule, measure the payoff distribution, subtract realistic costs, protect an untouched test period, and check whether the result is stable across time and instruments. When those pieces are missing, the honest position size is zero.
YOUR TURN
Pick one candle setup you follow and write down its entry, exit, average win, average loss, and realistic cost. Which missing input changes your confidence the most?
AI tools assisted with source organization, calculation cross-checks, and editorial quality control. Danny Hwang reviewed the primary-source claims, formulas, scope limits, and final conclusions.
Update history
- July 21, 2026 Rebuilt the article around the correct measurement distinction between reversal rate and trade win rate; removed the unsupported long-horizon portfolio-loss projection, mismatched calculator, and unverified pattern statistics; refreshed source links and methodology limits.