
Freeze the drawing rule and wait until each anchor is confirmed. Keep failed lines in the record; a line selected afterward cannot establish a trading edge.
📅 Originally Published: · Last Reviewed:
Trendline survivorship bias makes a line chosen after the fact look more reliable than it was in real time. When you keep the line that worked and forget the alternatives—or move its anchors after seeing the result—the apparent success includes hindsight. Before the line changes a position, record how it was drawn, when its anchors became knowable, and what would count as failure. Then evaluate the complete rule on fresh data, including the cost of each trade.
All sections and evidence
You draw a rising line under three lows. The next touch looks like a perfect bounce. But if you drew the line after that bounce was visible, you have explained a result rather than predicted one. Different anchors could have produced a different slope, a different break, or a line you would never have saved.
That distinction does not make trendlines useless. A line can describe a trend or become part of a testable rule. The question is whether you could have drawn and acted on the same line before the outcome was known.
Four Gates Before You Trade
Before a trendline affects money, make the rule reproducible, freeze it before the outcome, test it on unused data, and compare the result with a benchmark suited to its purpose. A line that fails an early gate should not advance to the next level of authority.
Gate 1: Can Another Person Reproduce the Line?
Write down the choices that the screenshot hides. Each choice should have one clear answer before you test:
- Data: State the price scale, bar length, and use of closes or intraday highs and lows.
- Anchors: Define which lows or highs qualify, when they are confirmed, and how you resolve ties.
- Signals: Set the touch count, distance from the line, and the kind of cross that counts as a break.
- Trades: Set entry, exit, stop, position size, fill timing, and the rule for drawing a new line.
- Outcomes: Define success and failure, the period you will measure, and how you count signals that overlap.
Another person should be able to draw nearly the same line from the same data. Judgment can help you think, but a trading test needs clear limits on that judgment.
Gate 2: Was the Rule Frozen Before the Outcome?
Save the chart and rule when all required anchors have been confirmed, before the price moves used to test the signal arrive. A timestamp alone cannot repair anchors chosen with future information. If a redraw is allowed, specify when it happens and preserve the earlier line and its result.
Keep a short log: anchor bars, confirmation bars, activation time, signal time, executable fill, costs, and outcome. Record overlapping signals under one prewritten rule rather than counting repeated touches as independent trades. The log should make failures as easy to find as successes.
Gate 3: Was the Final Rule Tested Without Reusing the Answers?
Separate rule development from evaluation. Build the rule on one period, then test it on a later period that did not influence the design. Once you alter the rule after seeing that test, the test has become development data and another untouched sample is needed.
List each version you tried that could change the result. Ten assets, four time frames, three anchor methods, two break definitions, and two exit rules create 480 possible combinations if all are tested. Those trials may be linked, and counting them alone does not remove the bias. Use a suitable multiple-testing method if you claim the winner is statistically significant. Also keep final test data aside; do not use it to choose the rule. If you choose the winner using that last sample, you have used up the test.
Gate 4: Did It Improve the Decision It Was Built For?
For a return-seeking strategy, compare net total return and risk with a benchmark using the same starting capital, market, and period. Include spreads, slippage, commissions if any, borrowing costs where applicable, and consistent tax treatment. Count distributions and the return on cash held while the strategy is out of the asset. Missed market gains already appear in the full return comparison; do not subtract them again as a separate fee.
For a risk-control rule, define the objective before testing. Lower drawdowns may be useful even with a lower return, but compare that tradeoff with a simpler lower-exposure portfolio as well. Report return, drawdown, exposure, turnover, and costs across the full period; avoiding one selected crash is not enough.
The rule should be defined before evaluation, tested on fresh data, compared with a fair benchmark, and reported with each cost that could change the result. Passing all four gates does not guarantee future success. Failing one means the line has not earned the authority being requested.
These checks set the evidence burden; they are not a certificate of future profitability. If the record is incomplete, keep the line as descriptive context while you test the rule.
When the Line Becomes Usable
An anchor has two dates: when the low happened and when your rule let you call it a low. A test must use the confirmation date. Drawing the finished line backward does not make it available for earlier trades.
Here is an invented example with daily bars on a linear price scale. Before testing, you define a swing low as a low below each of the two bars before it and the two bars after it. You connect two confirmed rising swing lows and keep those anchors fixed. Equal lows do not qualify under this example’s rule. Assume bar 12 closes at $108, above the line’s $107 level when it becomes usable.
| Event | What you know then | Allowed action |
|---|---|---|
| Bar 5 has a $100 low | It is only a candidate until bars 6 and 7 finish with higher lows | Confirm anchor A at the end of bar 7, if the conditions hold |
| Bar 10 has a $105 low | It becomes anchor B only after bars 11 and 12 finish with higher lows | Freeze the line after bar 12; its slope is $1 per bar |
| Bar 13 closes at $107.50 | The projected line at bar 13 is $108; the close is below it | Record a break if the prewritten rule says any close below the line is a break |
| Bar 14 opens | The bar-13 closing signal is now known | For a next-open execution rule, use the available bar-14 fill with costs, not an assumed bar-13 closing fill |
When the information becomes usable
Invented daily bars; two later bars confirm each low.
- After bar 7Confirm A: the $100 low at bar 5.
- After bar 12Confirm B: the $105 low at bar 10. Freeze the line; bar 12 closes at $108, above its $107 level.
- Bar 13 close$107.50 is below the projected $108 line. The example records a break now.
- Bar 14 openThe next-open rule can execute now, using the available fill and costs.
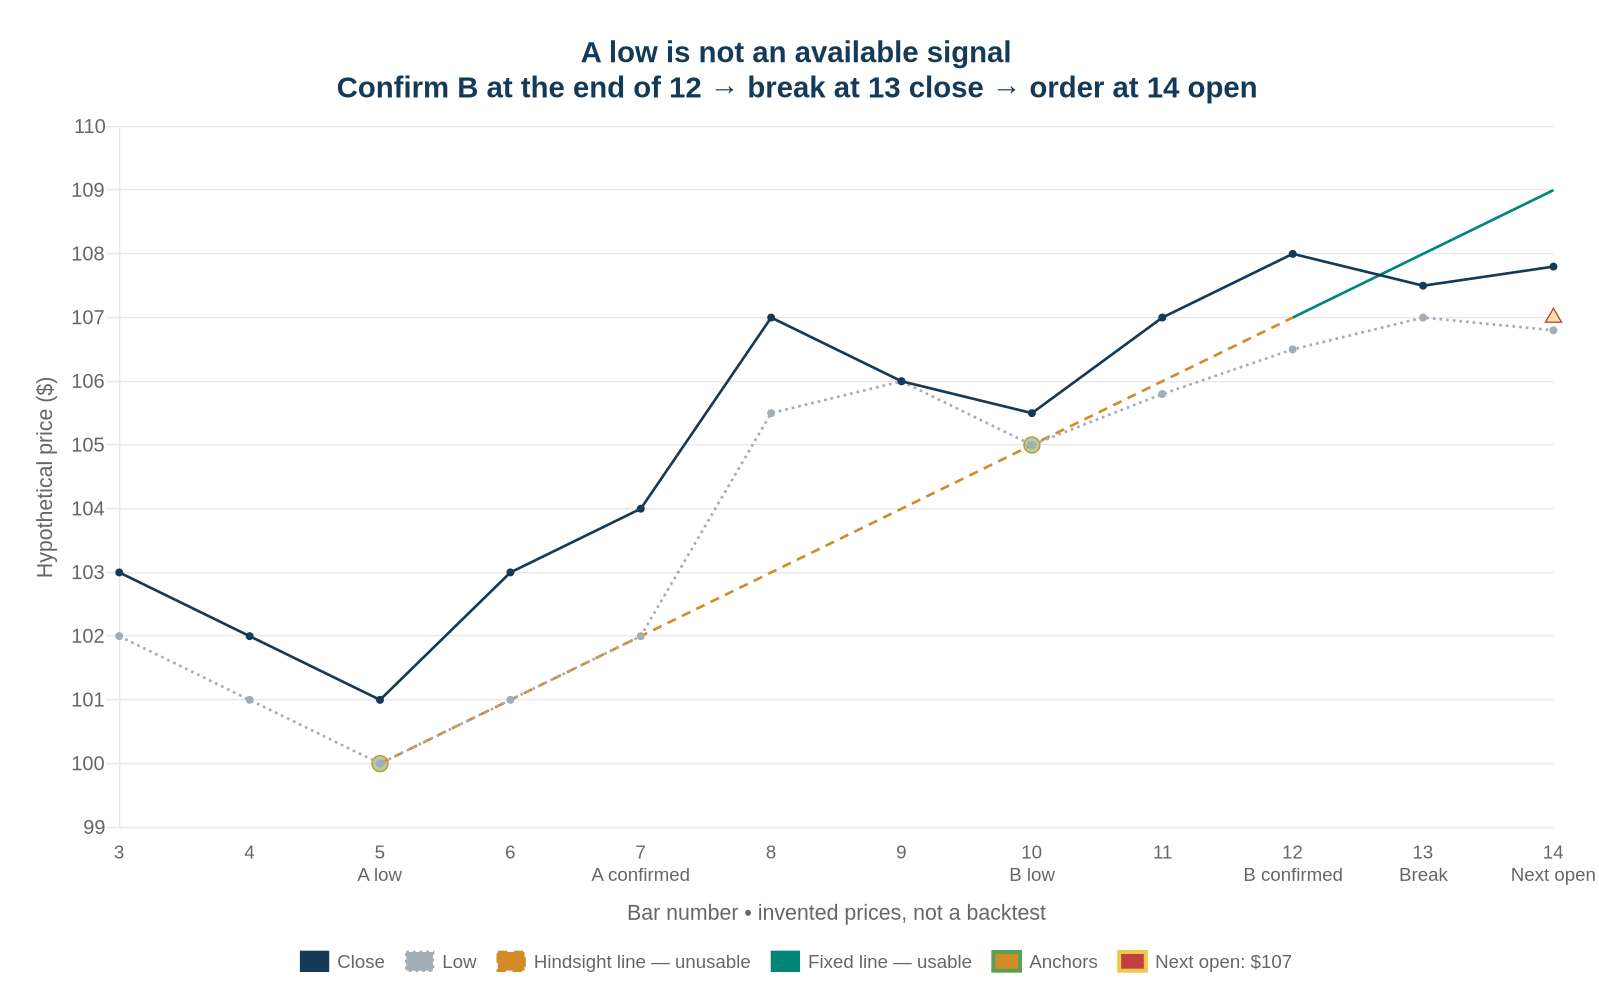
For this example, line price at bar n = 100 + (n − 5) × 1. The line can be projected after bar 12, but a trading record cannot pretend the second anchor was confirmed on bar 10. Moving that anchor after the bar-13 break would change the hypothesis; it would not undo the break.
A break of the line and a losing trade are different outcomes. The hypothetical break above might even help an exit strategy. Decide beforehand whether you are testing a bounce, a breakout, or portfolio risk control, then define the outcome and evaluation window for that purpose.
A third touch is another observation, not proof of an edge. If you require a third touch to activate the rule, record when that requirement was met. Do not use the touch both to choose the line and to claim an independent forecasting success.
What Trendline Survivorship Bias Means
Trendline survivorship bias is a practical label used in this guide, not a standardized academic term. It brings together anchors chosen with hindsight, a search across many rules, and a memory that keeps the wins but drops the failures.
A final screenshot shows the selected line but rarely shows the rejected alternatives. Suppose a chart offers ten plausible ways to connect prior lows. You try several, discard the ones that break quickly, and keep the line that price later respects. The survivor now looks predictive even though the selection process used information from the same price history the line is supposed to explain.
The more precise problem is choosing the winner after seeing the result. Try enough assets, time frames, anchor rules, and break tests, and one version may look good by chance.
The clean-chart problem: the image preserves the winning line while hiding the moved anchors, rejected slopes, failed breaks, and rules that were quietly abandoned.
Hand-drawn lines are hard to audit because two careful traders may draw them in different ways. Linear and logarithmic scales change the geometry. Intraday extremes can produce a different line from closing prices. A wick break may count for one trader and not another. Each choice may have a sound reason. But a hidden choice lets you change the test without showing the reader what changed.
A redraw can be legitimate if the method specifies it in advance. The problem is erasing the old line and its failed signal from the record. Keep the original result even when a new line replaces it.
This guide covers hand-drawn lines and partly rule-based lines used by retail investors. It does not treat every price indicator or model used by a professional trader as a hand-drawn line.
What the Research Actually Shows
The research does not establish one universal annual cost for trendline trading. It supports a narrower conclusion: testing many rules can produce lucky winners that do not hold up on new data. Some studies still find signals or profits in certain markets and periods.
The four studies below answer different questions. Read them on their own terms rather than using selection bias to explain every losing strategy.
| Study | What it examined | What it supports | What it does not prove |
|---|---|---|---|
| Lo, Mamaysky & Wang (2000) | Automated chart-pattern recognition in U.S. stocks from 1962 to 1996 | Several technical patterns contained incremental information about later returns | That a discretionary trendline reliably earns net profits |
| Park & Irwin (2004) | A review of 92 modern technical-analysis studies | Positive findings were common, but many studies had weaknesses involving rule selection, data snooping, risk, or costs | That all positive studies were invalid |
| Bajgrowicz & Scaillet (2012) | 7,846 technical rules on Dow Jones data from 1897 to 2011, with false-discovery controls | The best historical rules could not be selected reliably in advance, and modest frictions could absorb apparent performance | A fixed annual drag for every trader or chart rule |
| Sermpinis et al. (2021) | More than 21,000 rules across 12 MSCI markets over 2004 to 2015 | Some short-term value remained, but profitability and persistence varied substantially across markets and tests | That no technical rule ever works or that every edge ends after exactly one month |
The papers examine groups of rules or patterns defined by code. None measures a single cost of this selection problem for retail accounts.
The distinction is important. Lo, Mamaysky, and Wang found information in automated patterns, not a demonstrated net return for a hand-drawn line. Bajgrowicz and Scaillet tested whether historical winners could be selected in advance and whether performance survived costs. The result applies to the rules and market in that test.
Sermpinis and coauthors evaluated portfolios of selected rules using a rolling out-of-sample procedure. Some short-term profits remained after the costs they assumed, but the results varied by market and year. That gives a reason to avoid claiming that every technical rule fails. It does not show that your chosen anchors work.
The Park and Irwin review provides context for the mixed literature. These papers are separate tests, so their findings cannot be pooled into an annual penalty for trendline use. For the general testing framework, see the technical-analysis backtest audit; this article focuses on the choices a finished drawing hides.
How Much Authority Should a Trendline Have?
A trendline can describe a price path or serve as a signal you can test. It becomes risky when it receives more authority than its evidence has earned, especially when it controls position size, entry, exit, or long-term allocation by itself.
Start with the decision the line is being asked to make. Describing recent price action requires less evidence than letting a break decide your entire exposure.
| How the line is used | Evidence burden | Practical route |
|---|---|---|
| Observation “Price has been making higher lows.” |
Low | Use it as descriptive context, not as a forecast |
| Trade filter “I enter only after a close above a defined line.” |
Moderate | Freeze the construction rule and test it on untouched data |
| Primary strategy “A break determines whether I own the asset.” |
High | Compare with a benchmark, include costs, test nearby settings, and write down the failure rule |
| Portfolio override “The line overrules my allocation plan.” |
Very high | Do not proceed unless the evidence is stronger than the policy being replaced |
Your record should contain every eligible line, including rejected candidates and breaks you preferred to ignore. Without that denominator, a collection of successful screenshots tells you little about the method.
For a long-term investor, a hand-drawn line should usually sit below a written investment policy statement. The policy can specify allocation ranges, rebalancing rules, liquidity needs, and the conditions that justify changing the plan. A chart may direct attention, but it should not silently rewrite those commitments.
Red flag: you can explain every successful line but cannot produce a dated record of the lines that failed, were moved, or were never traded.
Frequently Asked Questions
Is trendline survivorship bias the same as ordinary survivorship bias?
They are related, but the selection happens in different places. Ordinary survivorship bias concerns the people, funds, firms, or assets still visible after failures drop out of view. Trendline survivorship bias, as used here, focuses on the line or rule selected after many alternatives were tried or discarded. Choosing after seeing the outcome is the more precise concern here.
Does the research prove that trendlines never work?
No. Lo, Mamaysky, and Wang found useful return information in some patterns defined by code. Sermpinis and coauthors found short-term value in parts of their sample. Past winners can be hard to choose in advance. Net profits depend on the test design, market, period, and costs.
How can I reduce hindsight when drawing trendlines?
Define the scale, anchors, touch requirement, break rule, entry, exit, and redraw policy before the next observation. Save the definition with a timestamp. Track every attempted line, including the ones that fail or are never traded.
Do zero-commission brokers remove the relevant costs?
No. A zero commission removes one visible fee. Bid-ask spreads, slippage, market impact, taxes, borrowing costs, and time out of the market can still change net results. The size of those effects depends on the asset, order type, turnover, account, and execution quality.
Should I replace every trendline strategy with passive indexing?
The evidence does not justify a universal command. A long-term investor should be skeptical when an untested line overrides a diversified policy. A clear rule tested on fresh data after costs deserves more weight than a line moved after each failure. Test nearby settings too, and compare the result with a fair benchmark.
Bottom Line
Trendline survivorship bias does not make every chart meaningless. It changes the burden of proof. A line chosen after seeing the price path is an observation, not independent evidence that the next move will follow it.
Before the line changes a position, check when the anchors became knowable, freeze the rules, preserve failed attempts, and evaluate fresh data against a suitable benchmark. If you cannot reconstruct that sequence, the finished chart has not established a trading edge.
Optional Appendix: Model an Assumed Return Shortfall
The studies do not give one annual cost for trendline trading. You can model how a return gap grows over time, using a gap you assume or measure. Label the result as a scenario; it is not a measured cost of using trendlines.
The illustration below asks a limited question: what happens if one path earns a chosen annual return and another path earns that return minus a chosen shortfall? The gap could reflect trading costs, taxes, time out of the asset, or another repeated difference. The model does not identify the cause.
| Assumed annual shortfall | 7.0% benchmark path | Lower-return path | Illustrative gap |
|---|---|---|---|
| 0.25 percentage points | $386,968 | $369,282 | $17,687 |
| 0.50 percentage points | $386,968 | $352,365 | $34,604 |
| 1.00 percentage point | $386,968 | $320,714 | $66,255 |
Values use annual compounding and no additional contributions. Each balance and each gap is rounded separately to the nearest dollar from its unrounded value, so subtracting displayed balances can differ from the displayed gap by $1. They are scenarios, not measured costs of choosing a line with hindsight.
Gap = P × [(1 + r)^t − (1 + r − d)^t]
P is the starting balance, r is the benchmark return, d is the assumed annual shortfall, and t is the number of years. Rates enter the formula as decimals: a 0.50-percentage-point shortfall means d = 0.005.
Assumption Gap Calculator
Compare a benchmark path with a path reduced by your assumed annual return shortfall.
| Year | Benchmark | Lower-return path | Gap |
|---|
For a measured gap, use each path’s annual compound growth rate (CAGR) for the same period. Enter benchmark CAGR minus strategy CAGR, in percentage points. The gap must be zero or positive. This model uses a fixed yearly rate for each path; it does not show changing yearly returns or drawdowns. An average of yearly returns is not the same as CAGR. Use CAGR when you want to match ending balances.
If the measured CAGR gap already reflects execution costs, taxes, and cash exposure, do not add those items again to the shortfall. You can also enter a hypothetical gap, but label it as your assumption. The resulting dollar amount says nothing about how likely a trendline is to work.
YOUR TURN
Could another person reproduce your current trendline from written rules alone, or would the chart still need your judgment?
- Lo, Mamaysky & Wang (2000): automated pattern recognition in U.S. stocks from 1962 to 1996; several patterns contained incremental information. Author-hosted abstract and publication details.
- Park & Irwin (2004): review of 92 modern studies, including the reported 58 positive, 24 negative, and 10 mixed findings; the review documents recurring testing limitations. Original report · University-hosted report PDF.
- Bajgrowicz & Scaillet (2012): 7,846 rules on DJIA data from 1897 to 2011, false-discovery controls, persistence tests, and transaction-cost analysis. Author-hosted paper.
- Sermpinis et al. (2021): more than 21,000 rules across 12 MSCI markets over 2004 to 2015; short-term value existed in parts of the sample, with variable profitability and persistence. Accepted manuscript.
Method: The studies were treated as separate evidence roles rather than combined into a synthetic annual drag. The three displayed scenarios were independently recalculated with annual compounding and rounded to the nearest dollar. The calculator reuses the TheFinSense gap engine with annual compounding and article-scoped input validation. The bar-number example is invented to illustrate confirmation and execution timing; it is not a backtest or investment recommendation.
Limits: The cited studies examine defined technical rules or automated patterns, not every discretionary trendline. Results vary by market, sample, rule family, transaction-cost assumption, and testing design. The calculator’s return shortfall is a reader-entered scenario, not an empirical estimate from the papers.
Update History
- VERIFICATION / SOURCE ACCESS
Rechecked the anchor-timing arithmetic and all three annual-compounding scenarios against the displayed assumptions, reviewed the cited research scopes, and added the university-hosted Park–Irwin report. Figures, diagram, calculator and conclusions are unchanged.
- NAVIGATION / VERIFICATION
Reordered the contents list to match the four-gate checklist and anchor-timing example already placed first. Rechecked the illustrative scenarios and existing calculator; figures, settings and analysis are unchanged.
- 2026-10 review 2026-10-15 UPDATE
Moved the optional return-shortfall model after the core decision and clarified percentage-point inputs. Rechecked the three annual-compounding scenarios; research findings and calculator settings are unchanged.
- v3.0 September 30, 2026 Substantive revision
Added anchor-confirmation and next-bar execution examples; clarified failure records, multiple testing, risk-control benchmarks, and CAGR inputs; repaired internal links, disclosure markup, calculator labels, and input validation.
- v2.0 July 21, 2026 Material correction
Removed the unsupported 1.0-percentage-point research composite and its $598,099 headline treatment; corrected the Lo, Bajgrowicz–Scaillet, Park–Irwin, and Sermpinis findings; removed unsupported legal and industry-wide cost claims; rebuilt the article as a decision test; and relabeled the calculator as an assumption-based scenario.
- v1.0 May 6, 2026 Published
Initial article released.