Skip to content
TheFinSense
Search
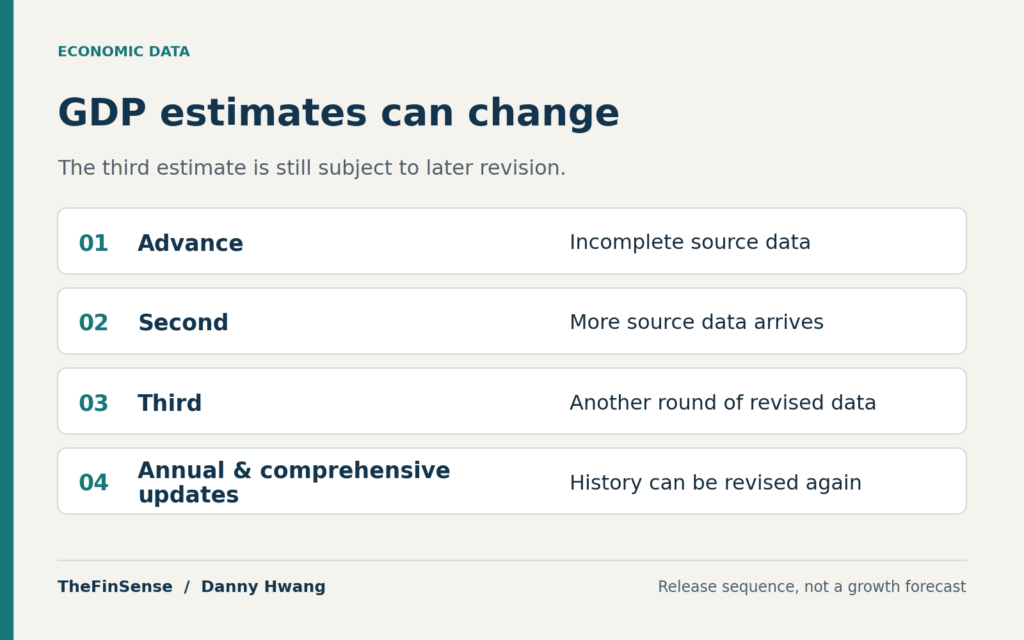
Advance, second and third GDP estimates are followed by annual and comprehensive updates; the third estimate remains subject to revision

Why GDP Is a Lagging Indicator and Why the First Estimate Can Mislead Investors

Part 4: Macro and Markets

GDP arrives after the quarter and changes as fuller data comes in. This guide compares official estimate vintages and gives investors a practical rule for deciding whether a headline warrants action.

Why GDP Is a Lagging Indicator and Why the First Estimate Can Mislead Investors Read More »
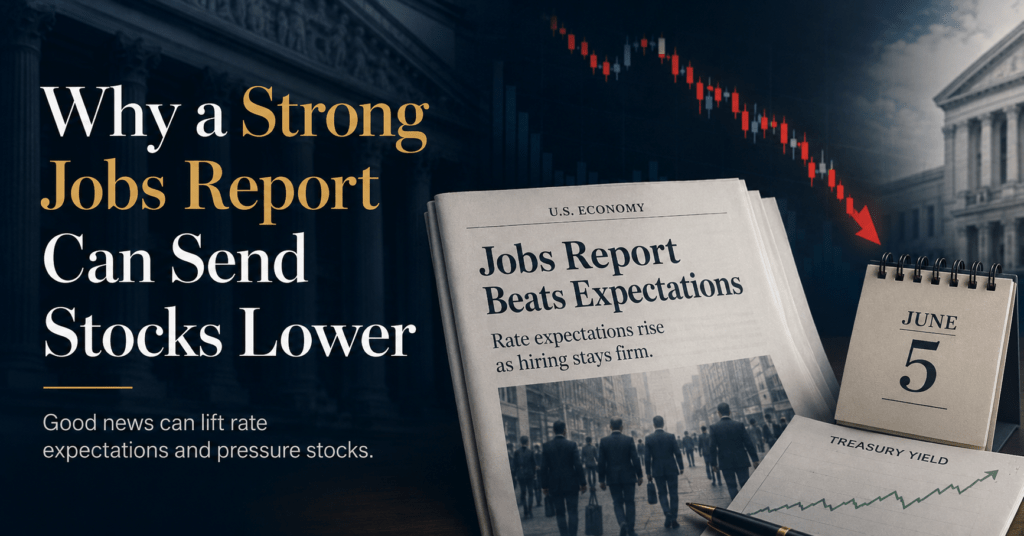
Strong jobs report stocks lower as rate expectations rise after the May 2026 payroll release

Strong Jobs Report: 3 Steps From Good News to Falling Stocks

Part 4: Macro and Markets

A strong jobs report can still hurt stocks. Trace hiring surprises, rate expectations and stock valuations before treating good news as a buy signal.

Strong Jobs Report: 3 Steps From Good News to Falling Stocks Read More »

CPI vs PCE inflation: choosing a gauge for household budgeting, benefits and Federal Reserve policy.

CPI vs PCE Inflation: Which Gauge Should You Use?

Part 4: Macro and Markets

CPI and PCE serve different purposes. Follow the exact index named in a payment rule, use PCE to interpret Fed policy, and test personal plans with explicit inflation assumptions. The worked model separates purchasing power from account dollars.

CPI vs PCE Inflation: Which Gauge Should You Use? Read More »

Fed meetings: Should you trade? Editorial illustration with a classical-column building background, by Danny Hwang for TheFinSense.

Fed Meeting: Should You Sell or Stay Invested?

Part 4: Macro and Markets

A scheduled Fed meeting is usually a weak reason to sell a diversified long-term portfolio. Compare a SPY strategy that skipped 80 decision days, then check the cash needs, allocation drift, and position risks that can justify an adjustment.

Fed Meeting: Should You Sell or Stay Invested? Read More »

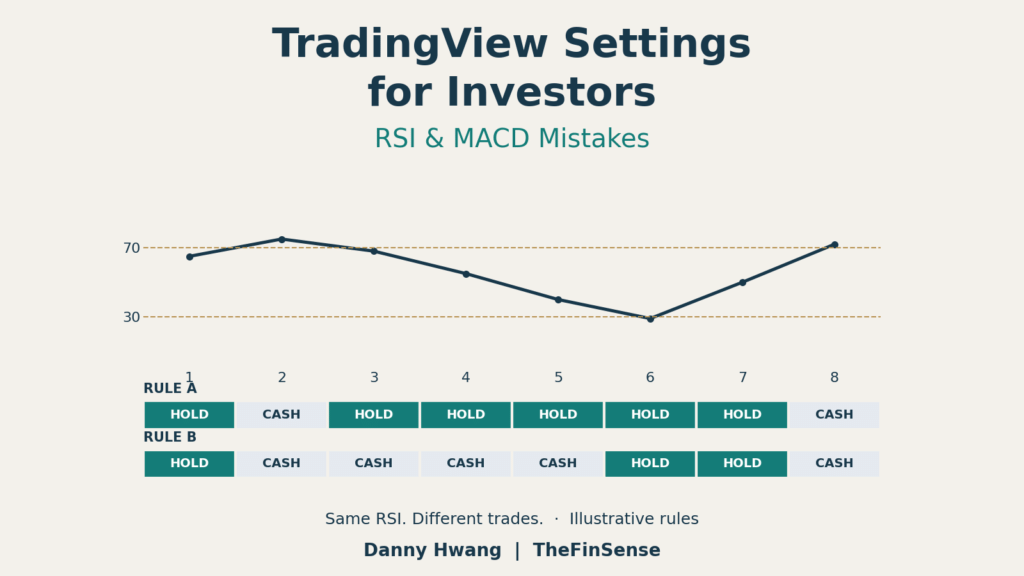
TradingView settings for investors: illustrative RSI readings with aligned holding and cash strips, by Danny Hwang at TheFinSense.

TradingView Settings for Investors: RSI and MACD Mistakes

Part 3: Trading Edge

A practical RSI and MACD setup for portfolio reviews, with daily-versus-weekly RSI charts, saved-alert guidance, and two rules that turn the same RSI into different holding and cash periods.

TradingView Settings for Investors: RSI and MACD Mistakes Read More »

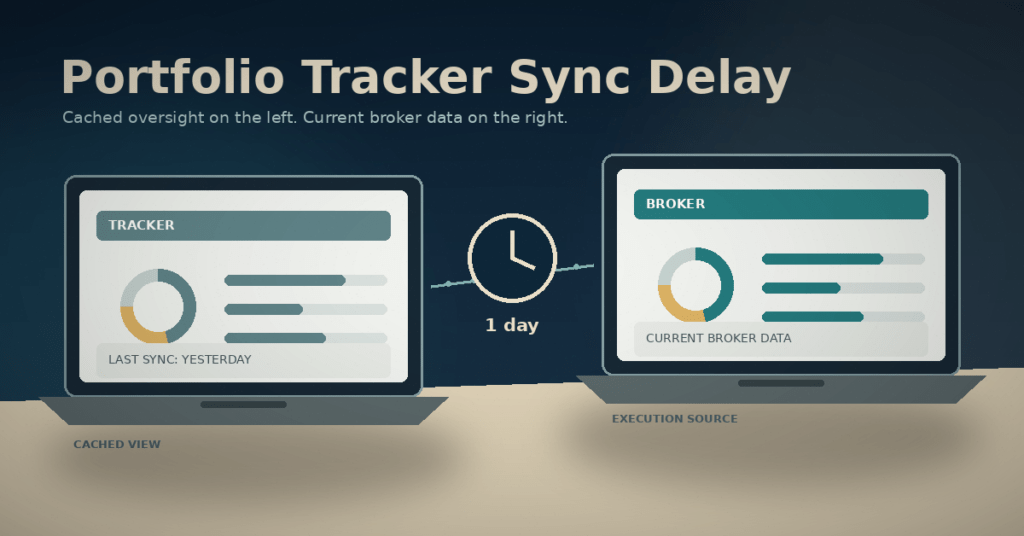
Portfolio tracker sync delay illustrated by cached tracker holdings beside current brokerage positions

Portfolio Tracker Sync Delay: Live Prices, Stale Holdings?

Part 3: Trading Edge

Live prices can sit on top of stale holdings. Compare share counts, calculate the display difference, and see why a recent trade may still be missing.

Portfolio Tracker Sync Delay: Live Prices, Stale Holdings? Read More »

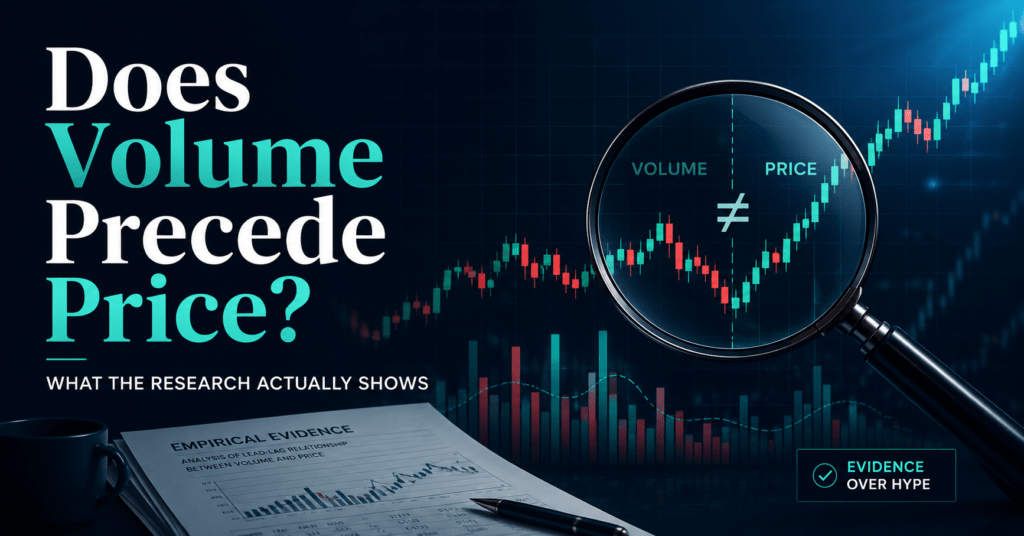
TheFinSense logo for volume precedes price research article

Does Volume Precede Price? What the Research Actually Shows

Part 3: Trading Edge

Trading volume can add information, but a larger bar is not a universal directional signal. Compare momentum and OBV evidence, then test whether your volume filter adds value.

Does Volume Precede Price? What the Research Actually Shows Read More »

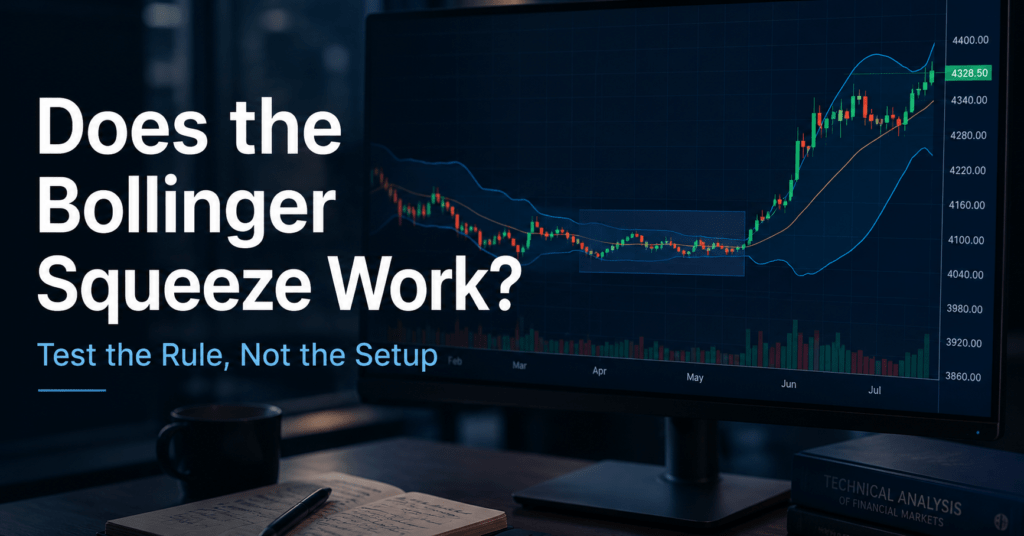
Bollinger Squeeze checklist separating a volatility setup from a complete trading strategy

Does the Bollinger Squeeze Work? Evidence and Trading Rules

Part 3: Trading Edge

A Bollinger Squeeze identifies volatility contraction. Examine direct research and a complete hypothetical rule before trusting a claimed trading win rate.

Does the Bollinger Squeeze Work? Evidence and Trading Rules Read More »

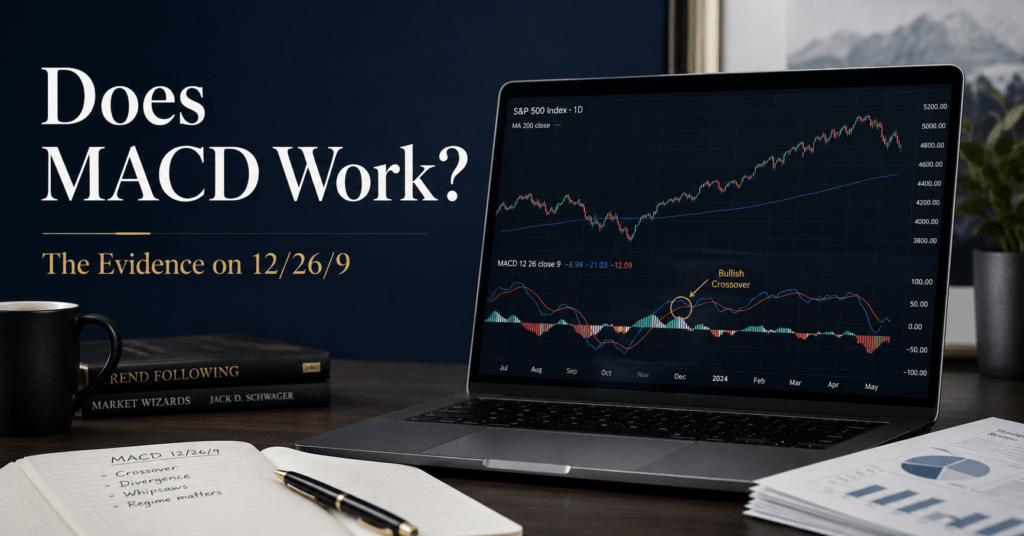
MACD chart on a laptop beside a notebook, with the title Does MACD Work?

Does MACD Work? What the 12/26/9 Evidence Shows

Part 3: Trading Edge

Check what the 12/26/9 MACD evidence shows. Compare five-market research and a disclosed SPY test, including costs, drawdowns and limits, before acting on a signal.

Does MACD Work? What the 12/26/9 Evidence Shows Read More »

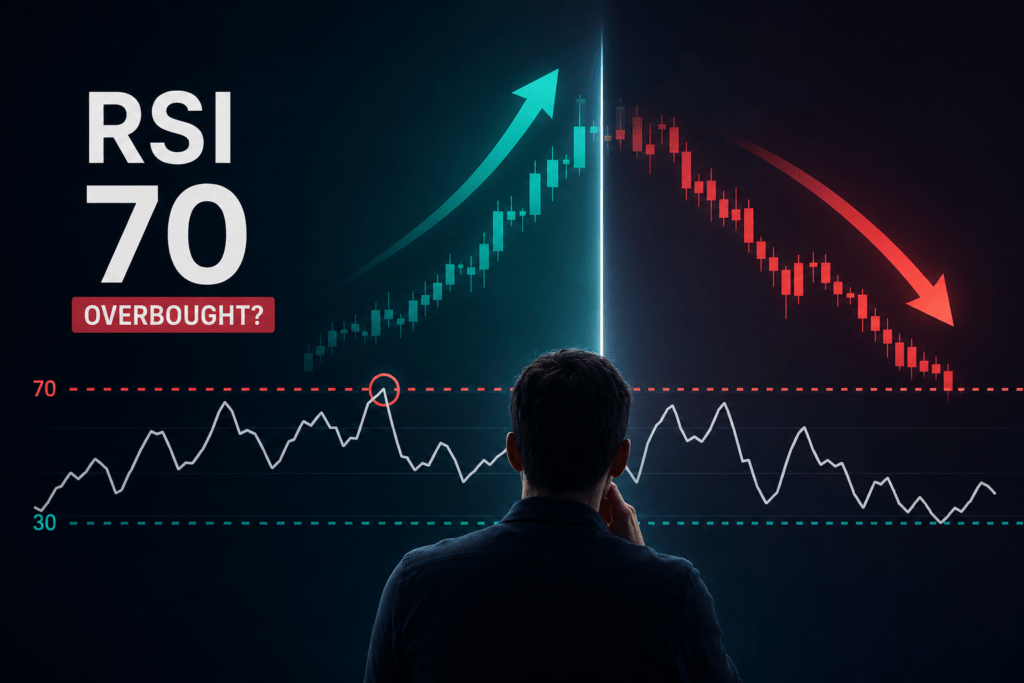
RSI overbought signal above 70 compared with trend-aware confirmation

RSI Overbought Signal: Why 70 Is Not an Automatic Sell

Part 3: Trading Edge

An RSI reading above 70 is not an automatic sell. Check position limits, predefined exits and re-entry rules, with a disclosed SPY example and research limits.

RSI Overbought Signal: Why 70 Is Not an Automatic Sell Read More »

← Previous 1 … 3 4 5 … 10 Next →
A close-up image of stacked coins with a blurred clock, symbolizing time and money relationship.
#image_title

RECENT POSTS

  • Backdoor Roth Pro-Rata Rule: Calculate the Taxable Amount
  • Roth IRA 5-Year Rule: Which Withdrawals Can Trigger Tax?
  • Traditional IRA Deduction Limits: Income, Workplace Plans, and Partial Deductions
  • Roth IRA MAGI: Is Your Income Really Too High?
  • IRA Contribution Limits for 2026: How Much Can You Contribute?

CATEGORIES

  • Part 1: Wealth Foundations (52)
  • Part 2: Stock Screening & Analysis (13)
  • Part 3: Trading Edge (11)
  • Part 4: Macro and Markets (11)
  • Part 5: Sectors, Themes & Alternatives (3)
  • Research (1)
  • Uncategorized (2)

TheFinSense

10 BusanDaeHak Ro, Busan,
GyeongSangNam Do, South Korea

Company

  • About TheFinSense
  • Contact TheFinSense
  • Privacy Policy
  • Cookie Policy | TheFinSense
  • Editorial Policy

© 2026 TheFinSense. Educational content only. Not investment, tax, or legal advice.

Manage Consent
To provide the best experiences, we use technologies like cookies to store and/or access device information. Consenting to these technologies will allow us to process data such as browsing behavior or unique IDs on this site. Not consenting or withdrawing consent, may adversely affect certain features and functions.
Functional Always active
The technical storage or access is strictly necessary for the legitimate purpose of enabling the use of a specific service explicitly requested by the subscriber or user, or for the sole purpose of carrying out the transmission of a communication over an electronic communications network.
Preferences
The technical storage or access is necessary for the legitimate purpose of storing preferences that are not requested by the subscriber or user.
Statistics
The technical storage or access that is used exclusively for statistical purposes. The technical storage or access that is used exclusively for anonymous statistical purposes. Without a subpoena, voluntary compliance on the part of your Internet Service Provider, or additional records from a third party, information stored or retrieved for this purpose alone cannot usually be used to identify you.
Marketing
The technical storage or access is required to create user profiles to send advertising, or to track the user on a website or across several websites for similar marketing purposes.
  • Manage options
  • Manage services
  • Manage {vendor_count} vendors
  • Read more about these purposes
View preferences
  • {title}
  • {title}
  • {title}