
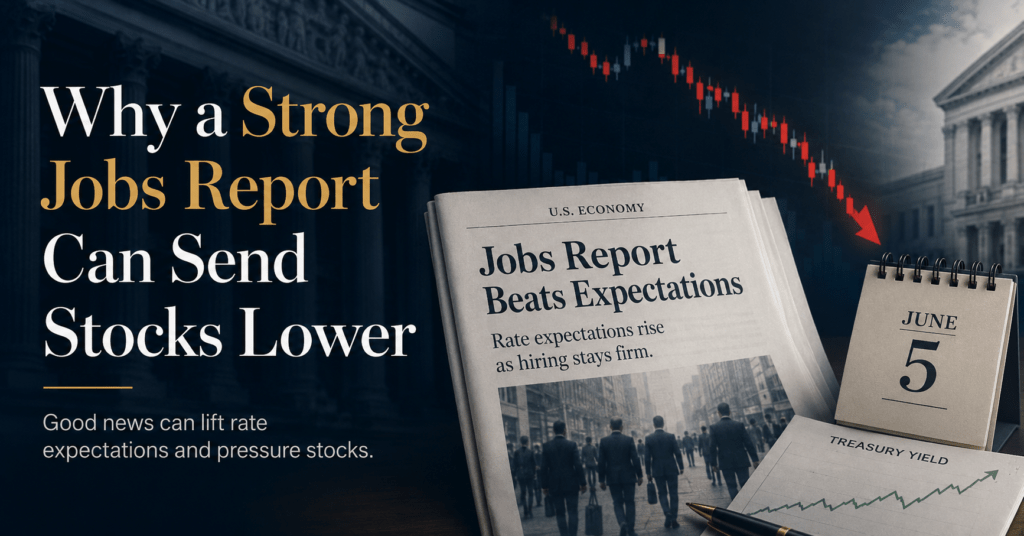
Stronger hiring can raise expected interest rates and pressure stock valuations. This three-step explanation does not isolate the cause of a whole day’s market move.
Updated:
Full answer and conditions
A strong jobs report can send stocks lower when investors think resilient hiring gives the Federal Reserve more room to keep interest rates high or raise them. That does not make every red jobs Friday a clean cause-and-effect event, and it does not turn one payroll estimate into a reliable trading signal. For a long-term investor, the practical question is whether the release changed the investment plan. A change in short-term rate expectations does not by itself establish that the long-term plan should change.
All sections and evidence
The June 5, 2026 market reaction illustrates the problem. The headline looked simple: hiring beat expectations and stocks fell. The full picture was less tidy. The jobs data pushed Treasury yields and rate-hike odds higher, while a sharp technology selloff did much of the damage to the major indexes.
Why Strong Jobs News Can Hurt Stocks
- Hiring exceeds expectations. Investors reassess growth and inflation pressure.
- Expected rates rise. Markets may price a tighter policy path; that is a forecast, not the Fed’s decision.
- Valuations face pressure. Higher discount rates can lower the present value of future earnings. Other news can still dominate the day.
On June 5, the Bureau of Labor Statistics reported that U.S. nonfarm payrolls increased by 172,000 in May. Economists polled by Reuters had expected an increase of 85,000, so the published estimate exceeded the consensus by 87,000 jobs.
The market response ran through interest rates. In its June 5, 2026 market report, Reuters recorded a 10-basis-point rise in the two-year Treasury yield to 4.15% after the release, while futures pricing increased the probability of a Federal Reserve rate increase by December. Higher expected rates can reduce the present value investors assign to future corporate earnings, especially for expensive growth stocks whose expected profits sit farther in the future.
Plain English
A healthy labor market is good for household income and company demand. The same strength can still be uncomfortable for stocks when investors think it will keep borrowing costs high. Both ideas can be true at once.
The S&P 500 fell 2.6% that day and the Nasdaq Composite fell 4.2%. The jobs report mattered, but it was not the only force at work. AP reported that large technology companies led the decline, with Micron down 13.3%, while the number of gainers and losers inside the S&P 500 was close to even. That combination is a warning against assigning an entire index move to one economic release.
Historical research shows why the same news can mean different things across the business cycle. In their 1990 working paper, McQueen and Roley found that stronger-than-expected real-activity news could coincide with lower stock prices when the economy was already strong. Their proxy-based tests linked the difference across economic states to expected cash flows, rather than a significantly different discount-rate response across those states.
Boyd, Hu, and Jagannathan’s 2001 working paper also found that unemployment news had different implications in expansions and contractions. It studies unemployment-rate surprises rather than payroll counts. These historical findings support a state-dependent mechanism, not a rule that every strong payroll report must push stocks down.
The next Federal Reserve decision showed why the jobs report should be treated as an input, not a command. On June 17, the Federal Open Market Committee kept its target range at 3.5% to 3.75%. The strong May report changed market pricing, but it did not mechanically force an immediate policy move.
A Decision Router for Long-Term Investors
The jobs report can matter without deserving an immediate order in a brokerage account. Start with the decision you actually face, not the headline the market is shouting.
How to respond to a strong jobs report without turning it into an improvised trade.
| Your situation | Reasonable response | Why |
|---|---|---|
| Diversified portfolio, long horizon, no near-term cash need | Do not change the portfolio because of one release. | The report is preliminary, revisions are normal, and the same-day market move has multiple causes. |
| You need money within the next year | Review the cash allocation and withdrawal plan. | The problem is time horizon and liquidity, not whether one payroll print was strong. |
| The red day reveals that your equity allocation feels intolerable | Revisit risk capacity and rebalance to a written target. | A durable allocation change may be justified, but it should not depend on guessing the next jobs report. |
| You follow a tactical strategy | Use the prewritten, tested rule and its execution timing. | Without a specified signal and execution rule, the reaction cannot be reproduced consistently in a backtest. |
| Several months of labor, inflation, and policy data change the outlook | Review the full financial plan, expected return assumptions, and cash needs. | A confirmed regime change can affect planning, but it requires more evidence than one headline. |
A written plan is more useful here than a forecast. TheFinSense’s guide to an investment policy statement explains how to define the conditions that can change an allocation before a stressful morning arrives.
What to Watch Instead of One Headline
For economic context, a wider dashboard beats a faster reaction.
1. The three-month payroll trend and revisions
A single estimate can move sharply when late employer responses arrive. The three-month average reduces the influence of one unusually strong or weak print, while revisions show whether the first estimate was dependable.
2. Unemployment, participation, and hours
Payroll growth can look healthy while unemployment or average weekly hours soften. Reading the household and establishment measures together gives a better view than forcing one figure to carry the whole story.
3. Wage growth and inflation
Strong wage growth can support spending, but it can also matter for inflation and rate expectations. The Fed does not decide policy from the jobs report alone. Its preferred inflation measure is PCE, which differs from CPI in coverage and weighting. See CPI versus PCE for that distinction.
4. The rate market and the Fed’s actual decision
Treasury yields and futures show how traders changed their expectations. The FOMC statement shows what policymakers actually did. Those are different things. The guide to how the Fed moves your portfolio explains the path from policy rates to bonds, stocks, and borrowing costs.
A single report can inform the plan, but a sustained pattern is what should change it.
The Jobs Report Has Two Surveys, Not One Answer
The monthly release combines two separate surveys. The establishment survey asks employers about payrolls, hours, and earnings. The household survey asks people about their labor-force status and produces the unemployment rate. They use different samples, definitions, and estimation methods.
In May 2026, the establishment survey estimated 172,000 additional payroll jobs, while the household survey showed the unemployment rate unchanged at 4.3%. Those results were not contradictory. They were different measurements of a large labor market.
A reader who wants to understand the economy should look past the payroll headline and ask at least four questions:
- Were the prior months revised up or down?
- Did the unemployment rate, participation rate, or employment-population ratio change?
- Were job gains broad across industries or concentrated in a few areas?
- What happened to hours worked and wage growth?
The BLS itself notes that precision improves when data is accumulated over time. That is a strong reason to prefer a multi-month view over a same-morning trade.
How Precise Is One Monthly Payroll Number?
The 172,000 figure is an estimate from a survey of employers, not a count of every payroll in the country. The BLS technical note says the 90% confidence interval for the monthly change in total nonfarm employment is on the order of plus or minus 122,000 jobs. It also warns about nonsampling error and explains that the two newest monthly estimates remain preliminary until more employer responses arrive.
That comparison is useful as a scale check, but it is not a formal statistical test of the forecast. The Reuters consensus has its own uncertainty, and the BLS confidence interval describes sampling error around the payroll estimate. The fair conclusion is narrower: the headline was less precise than a single number on a screen made it appear.
Revisions are the second reason to stay modest. In the May release, BLS revised April payroll growth from 115,000 to 179,000, an increase of 64,000. A trader who treated the first April estimate as final would have been acting on a number that later changed substantially.
What the May 2026 payroll headline did and did not establish.
| Headline fact | What it supports | What it does not prove |
|---|---|---|
| Payrolls rose by 172,000 | The BLS employer survey estimated solid May job growth. | That every segment of the labor market strengthened. |
| The estimate beat consensus by 87,000 | The release was stronger than the Reuters economist poll expected. | That the exact surprise was measured without meaningful uncertainty. |
| Treasury yields rose after the release | Markets priced a tighter expected rate path. | That the jobs report alone caused the full stock-market decline. |
| The S&P 500 fell 2.6% | Rate concerns and a technology selloff hit the cap-weighted index. | That long-term investors received a reliable sell signal. |
Frequently Asked Questions
Why can a strong jobs report make stocks fall?
Strong hiring can raise expectations that the Federal Reserve will keep rates high or raise them. Higher discount rates can reduce the present value of future earnings, which can pressure stock valuations. The effect is state-dependent and may be outweighed by earnings news, valuation concerns, geopolitics, or sector-specific selling on any given day.
How accurate is the monthly jobs report?
The payroll estimate is useful, but it is not exact. The BLS says the 90% confidence interval for the monthly payroll change is on the order of plus or minus 122,000 jobs, and the newest two months are preliminary. The release is also subject to nonsampling error and later revisions.
How large was the May 2026 payroll surprise?
The BLS estimate of 172,000 exceeded the cited Reuters economist consensus of 85,000 by 87,000 jobs. That surprise measures the gap from that poll, not a change in payrolls between two releases. Keep the release vintage and consensus source matched.
Should a long-term investor sell after a strong jobs report?
Not solely because of the report. A sale may be appropriate when cash needs, taxes, risk capacity, or a written allocation rule require it. A single preliminary release and a red market screen are not enough to establish that the long-term plan has changed.
What is the difference between the household and establishment surveys?
The establishment survey asks employers about payrolls, hours, and earnings. The household survey asks people about employment and labor-force status, and it produces the unemployment rate. Because the surveys use different samples and definitions, they can move differently in the same month.
The Bottom Line
A strong jobs report can push stocks lower through the interest-rate channel, but the same-day index move is rarely a one-cause event. The May 2026 release was stronger than economists expected, Treasury yields rose, and technology stocks sold off sharply. The Federal Reserve still held rates steady twelve days later.
For a long-term investor, one preliminary payroll estimate should not make a decision that belongs to your time horizon, cash needs, tax position, and written allocation. Read the revisions, watch the trend, and change the plan only when the broader evidence changes it.
Your turn
What part of a jobs report most tempts you to react: the payroll number, the market drop, or the change in rate expectations?
Update history
View dated amendments
- Navigation review 2026-10-19 NAVIGATION / SOURCE
Aligned the contents list with the existing section order and pinned the sampling-error source to the May 2026 release archive. The 122,000-job half-width, 71.3% scale comparison, and other release figures are unchanged.
- Backtest clarification October 17, 2026 CLARIFICATION Clarified that backtest reproducibility requires specified signal and execution rules; an improvised reaction is not inherently impossible to test later. Release figures and calculations are unchanged.
- Research clarification October 17, 2026 CLARIFICATION
Linked the full working-paper versions and clarified their state-dependent findings and proxy-based limits. Clarified the author description and educational scope without making personal-work, compensation, or holdings assertions. Release figures and calculations are unchanged.
- Article amendment October 15, 2026 CORRECTION
Identified the confidence-interval half-width used in the 71.3% comparison and narrowed the opening claim.
- Article amendment October 15, 2026 CORRECTION
Dated and linked the June 5 market reaction explicitly; retained the reported yield and release-versus-consensus calculation.
- Article amendment October 14, 2026 CORRECTION
Replaced the prior-version correction FAQ with the current release-versus-consensus interpretation; existing material correction history preserved.
- Article amendment June 15, 2026 PUBLISH
Published.
- Article amendment July 26, 2026 CORRECTION
Corrected the May consensus surprise from 92,000 to 87,000; removed the invalid $10,760 hold-versus-react model and its calculator; added the June 17 Federal Reserve outcome; replaced the original case-led structure with a decision router; refreshed sources, internal links, author title, and trust disclosures.