
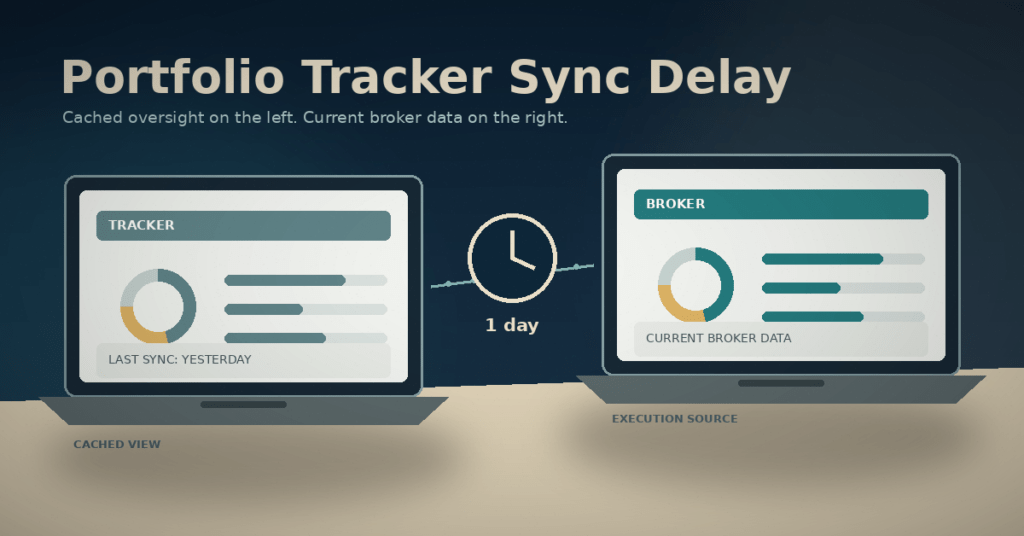
A portfolio tracker sync delay is usually a data-freshness issue, not a recurring return drag. In five independent 3,000-path simulations, the one-trading-day delayed portfolios finished about $22 lower on average after 30 years. The corresponding same-day portfolios had a median ending value near $2 million. The delay helped 51.8% of paths, so it did not create a reliable penalty. Use the tracker for monitoring, but confirm current holdings in your brokerage before placing a trade.
What Is a Portfolio Tracker Sync Delay?
A portfolio tracker sync delay is the time between a change at your brokerage and that change appearing in a separate dashboard. Cached investment data may refresh roughly daily, while some direct connections can fetch newer holdings on request. The important distinction is operational: a tracker is useful for oversight, but a broker is the source to check before trading.
You open the dashboard, notice your stock allocation has crossed its limit, and wonder whether yesterday’s holdings have already cost you money. That concern is reasonable. The mistake is turning a short detection lag into a fixed annual fee. A delay changes the timing of occasional rebalances; it does not deduct the same percentage from the portfolio every year.
Which Data Source Should You Use?
Use a cached tracker for long-term monitoring and a broker-native screen for any decision that requires current positions. Real-time third-party data earns its price only when the dashboard itself supports an intraday operational task. It is not necessary simply because you rebalance a diversified portfolio.
| What you are doing | Best source | Pay for real-time? |
|---|---|---|
| Monthly or quarterly portfolio review | Cached portfolio tracker | No. Daily freshness is more than enough. |
| Checking a tolerance-band alert | Tracker for the alert, brokerage for confirmation | Usually no. |
| Choosing tax lots or placing a same-day rebalance | Broker-native positions, prices, and tax-lot data | Possibly, but only if the paid connection improves the workflow. |
| Intraday, leveraged, or options trading | Broker or dedicated market-data platform | A consumer portfolio tracker should not be the execution source. |
This distinction matters more than whether the dashboard says “live.” A current price layered on stale share quantities can still produce a misleading allocation. The decision table keeps the data source matched to the consequence of being wrong.
How Fresh Is Portfolio Tracker Data?
There is no universal refresh schedule. Plaid’s official documentation says investment updates may be assessed over periods of 24 hours or more, while SnapTrade offers separate daily and real-time holdings modes. The app name alone does not tell you the data cadence; the connection type and brokerage determine it.
Plaid’s Investments product supplies holdings and transaction data to financial-management applications. Its institution-status documentation notes that investment updates refresh less frequently than many other data types and may use a 24-hour-or-longer assessment window. That supports a durable statement: some aggregated investment data is daily rather than streaming. It does not support claiming that every popular tracker refreshes at the same overnight hour.
SnapTrade documents the other side of the market. On its Daily mode, holdings are cached and refreshed once per day. On its Real-time mode, supported holdings endpoints fetch newer brokerage data when called. Even then, availability still depends on what the brokerage exposes.
For a long-term investor, the most useful setting is not the one with the fastest label. It is the one that clearly shows the last successful sync and makes it easy to verify the account at the broker. A written investment policy statement also prevents a stale dashboard from becoming an impulsive trading signal.
Official source: Plaid states that investment updates are refreshed less frequently and may be assessed over 24 hours or more. Read Plaid’s institution-status documentation.
Official source: SnapTrade distinguishes Daily holdings, refreshed once per day, from Real-time holdings fetched when supported endpoints are called. Read SnapTrade’s data-freshness documentation.
What the 15,000-Path Test Found
The simulation found no consistent long-term penalty from a short detection delay. Across five independent 3,000-path batches, the one-day delayed portfolios finished about $22 lower on average over 30 years. Longer delays also produced small average differences relative to a median terminal portfolio near $2 million, while the direction remained close to a coin flip.
The test compared same-day threshold rebalancing with rebalancing delayed by 1, 5, 21, or 63 trading days. Every path started with $100,000, added $1,500 each month, targeted a 60/40 stock-bond mix, and rebalanced when the stock weight moved outside 55% to 65%. A five-basis-point cost was charged on the amount traded.
| Detection delay | Average terminal difference | Share of paths delay helped | Approximate 5th-95th range |
|---|---|---|---|
| 1 trading day | −$22 | 51.8% | −$55,000 to +$54,000 |
| 5 trading days | +$778 | 51.1% | −$62,000 to +$65,000 |
| 21 trading days | +$2,694 | 51.6% | −$66,000 to +$77,000 |
| 63 trading days | +$6,662 | 52.9% | −$70,000 to +$98,000 |
The averages are small, but the path-by-path differences are not. A near-zero average does not mean the delay never matters on an individual path. A delayed rebalance can help or hurt because prices keep moving while the trade waits. The model found no stable direction, not identical outcomes.
Plain English
A sync delay behaves more like timing noise than an expense ratio. An expense ratio pulls every path in one direction. A delayed rebalance can finish ahead or behind, and its average effect was small in this test.
That result also explains why the right comparison is not “real-time versus losing money.” The better comparison is “cached oversight plus broker confirmation” versus “paying for a faster dashboard.” For most long-term portfolios, the first workflow is sufficient.
Simulation scope and assumptions
Design: Five independent Monte Carlo batches of 3,000 paths each, 30 years per path, using fixed seeds 20260724 through 20260728.
Portfolio: $100,000 starting balance, $1,500 monthly contribution, 60% stocks and 40% bonds, with stock rebalancing bands at 55% and 65%.
Illustrative annual assumptions: stocks 8% arithmetic return and 18% volatility; bonds 3.5% return and 6% volatility; stock-bond correlation 0.10.
Trading: Five basis points charged on the amount traded. A delayed trade was executed only if the portfolio remained outside the band when the delay expired.
Interpretation: This is a controlled scenario test, not a forecast. It does not model taxes, outages, incorrect holdings, intraday execution, leverage, or behavioral trading.
Why a Fixed Drag Calculator Gives the Wrong Answer
A portfolio tracker sync delay cannot be modeled honestly as a permanent annual return drag. The portfolio only experiences a timing difference when a rebalancing threshold is crossed, and the later price can be higher or lower. Compounding an assumed drag every year manufactures a large lifetime cost that the mechanism does not impose.
Suppose a calculator asks you to enter a 0.003% annual “sync-delay drag.” The formula will reliably produce a loss because the loss was inserted as an input. It has not measured how often your portfolio crosses a band, whether the stale allocation would have triggered a trade, or what prices did before the delayed execution.
A valid tool would need to simulate the portfolio path, the rebalancing rule, the detection cadence, and the execution delay together. That is why this article uses a reproducible path simulation rather than an annual-drag calculator.
The distinction is useful beyond tracking apps. A recurring fee such as an expense ratio can be compounded as a steady drag. An occasional timing event cannot be treated the same way.
Should You Pay for Real-Time Tracking?
Do not pay for real-time tracking solely to improve long-term rebalancing returns. Pay only when fresher third-party holdings solve a specific operational problem that broker-native data cannot solve conveniently. The subscription should earn its fee through the workflow, not through a promised return advantage.
Three gates for a paid real-time connection
Vanguard describes rebalancing as a risk-management process rather than a market-timing strategy. It notes that annual rebalancing is optimal for many investors and warns that schedules should not be excessively frequent. That does not prove every delay is harmless, but it puts the scale of the decision in context: constant reaction is not the objective.
Kitces’ review of tolerance-band research adds a useful nuance. Checking less often than roughly every two weeks reduced the benefit of opportunistic rebalancing in the study he discussed. That finding supports regular monitoring for a threshold strategy. It does not require streaming holdings or prove that an overnight cache causes a return loss.
Official source: Vanguard says the purpose of rebalancing is to manage risk, not maximize returns, and that annual rebalancing is optimal for many investors. Read Vanguard’s guidance.
Supporting research review: Kitces discusses tolerance-band evidence in which checking less often than every 10 trading days produced diminishing benefits. Read the analysis.
ONE-PAGE CHECKLIST
Sync-Delay Reality Check
Use the three gates, confirm the correct data source, and decide whether a real-time connection solves a real problem.
For the rebalancing rule itself, see the full portfolio rebalancing strategy guide. The alert cadence matters less when the rule is written before markets move.
Portfolio Tracker Sync Delay FAQ
Does a portfolio tracker sync delay cost money?
It can change a particular outcome, but the simulation found no consistent penalty. Across five 3,000-path batches, the one-day delayed portfolios finished about $22 lower on average over 30 years and the delay helped 51.8% of paths. Treat that as model evidence, not a guarantee for every portfolio.
How often does Plaid investment data refresh?
The cadence depends on the institution and connection. Plaid’s official institution-status documentation says investment updates refresh less frequently and may be assessed over 24 hours or more. Avoid promising a universal overnight time for every tracker.
Is real-time data useful for rebalancing?
It can be useful for an intraday operational workflow, but a long-term investor can usually use a tracker for monitoring and confirm current positions at the brokerage before trading. Real-time data does not create a guaranteed rebalancing return advantage.
How often should I check a tolerance-band portfolio?
A regular schedule is more important than continuous watching. The tolerance-band research reviewed by Kitces found diminishing benefits when checks became less frequent than about every 10 trading days. A weekly or biweekly check can therefore be reasonable, with the actual trade confirmed at the broker.
Why was no sync-delay calculator included?
A simple calculator would need to assume a fixed annual drag, but a sync delay is an occasional path-dependent timing event. The later trade can help or hurt. A path simulation is the appropriate tool for this question.
The Bottom Line on Portfolio Tracker Sync Delay
A cached portfolio tracker is usually good enough for oversight. Before placing a trade, open the brokerage account and confirm the current positions, prices, tax lots, and buying power there.
Pay for real-time tracking only when it improves a specific intraday workflow that the broker cannot handle conveniently. Do not buy it because a fixed-drag calculator claims that yesterday’s dashboard compounds into a lifetime loss. The simulation did not find that mechanism.
For a long-term investor, the decision is simple: write the rebalancing rule, check on a regular schedule, and use the broker as the execution source.
What would real-time data change for you? Name the exact decision you would make differently. If there is no concrete answer, the cached plan is probably enough.
- Plaid: Official Investments and institution-status documentation used for the daily-cache discussion.
- SnapTrade: Official Real-time versus Daily documentation used to distinguish cached and on-request holdings.
- Vanguard: Official rebalancing guidance used for the purpose and frequency of rebalancing.
- Kitces: Supporting review of tolerance-band monitoring research.
- TheFinSense simulation: 15,000 Monte Carlo paths in five independent batches. Exact model assumptions and result-file hash are disclosed above. The test is hypothetical and does not predict future returns.
This article was produced with AI assistance and reviewed by Danny Hwang. The numerical claims in this analysis were independently reproduced in Python and checked against the disclosed model assumptions.
📋 Update History
- July 24, 2026: Replaced the provisional 3,000-path result with five independent 3,000-path production batches, corrected the interpretation from “zero cost” to “no consistent penalty,” removed the unsupported fixed annual-drag calculator, and refreshed the data-freshness sources.
- May 24, 2026: Initial publication.
Financial disclosure: TheFinSense does not sell portfolio-tracking software and has no affiliate or referral relationship with Plaid, SnapTrade, Vanguard, or Kitces.com. No compensation was received for any mention.
Educational content only, not investment, tax, or trading advice. Simulated results are hypothetical, depend on stated assumptions, and do not guarantee future performance.