Skip to content
TheFinSense
Search
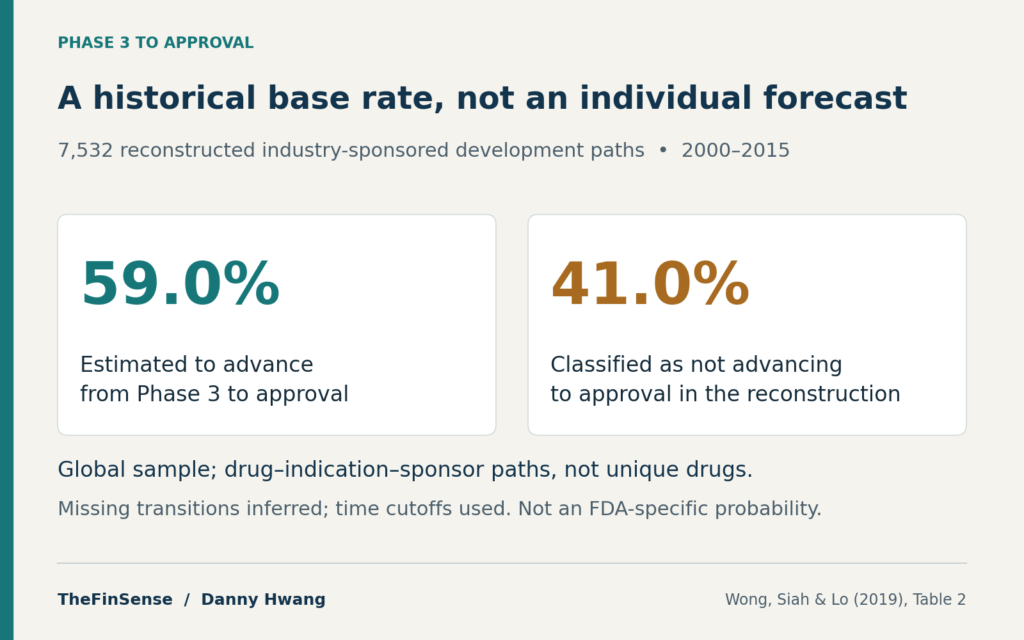
In the 2000–2015 global industry dataset, 59% of reconstructed Phase 3 paths were estimated to advance and 41% classified as not advancing; this is not an individual FDA probability

Phase 3 Approval Rate: Only 59% of Programs Make It

Part 5: Sectors, Themes & Alternatives

The study estimates that 59.0% of Phase 3 development paths advanced to approval in its reconstructed 2000–2015 dataset. Compare nine therapeutic groups, two datasets and six checks before a decision date.

Phase 3 Approval Rate: Only 59% of Programs Make It Read More »

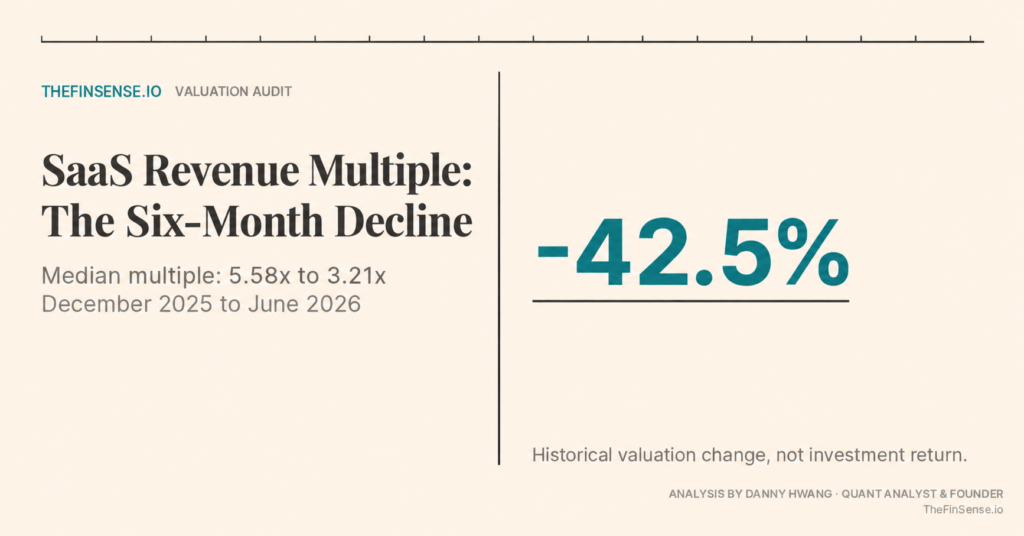
SaaS Capital Index median revenue multiple declined 42.5%, from 5.58x in December 2025 to 3.21x in June 2026; historical valuation change, not an investment return.

SaaS Revenue Multiple: The 42.5% Drop from December 2025 to June 2026

Part 5: Sectors, Themes & Alternatives

The SaaS Capital Index median fell 42.5% from December 2025 to June 2026. Follow the monthly path, compare operating medians, and separate a fixed-revenue valuation model from investment returns.

SaaS Revenue Multiple: The 42.5% Drop from December 2025 to June 2026 Read More »

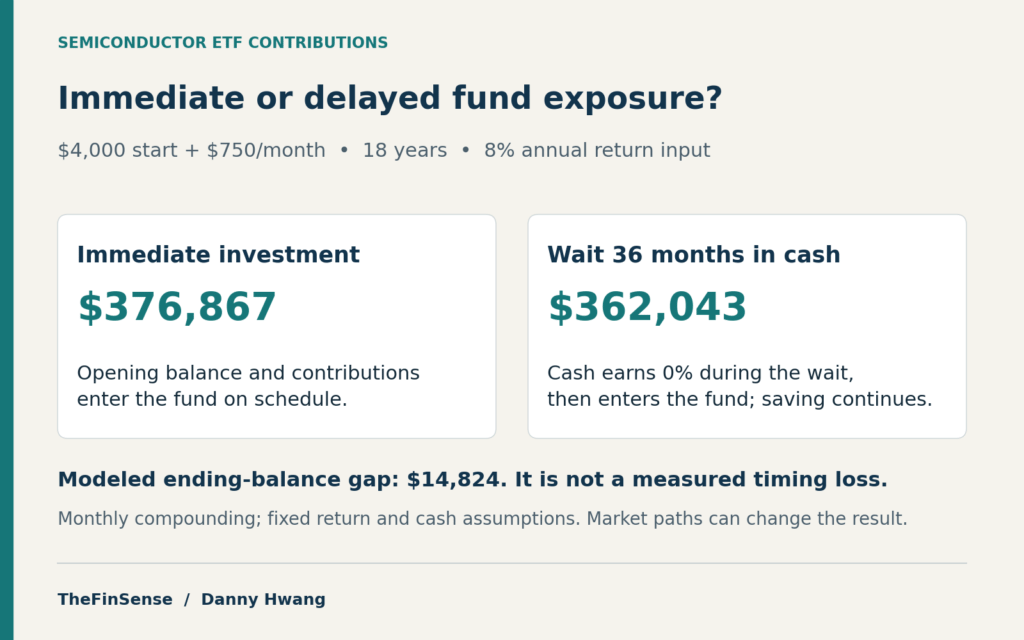
Fixed-input scenario: $4,000 start, $750 monthly, 18 years, 8% annual input, 36-month wait at zero cash return; the modeled $14,824 gap is not a measured timing loss

Semiconductor ETF Dollar Cost Averaging: Costly 3-Year Wait?

Part 5: Sectors, Themes & Alternatives

Semiconductor ETF dollar cost averaging or waiting for a dip? Test a three-year delay, cash returns and sector risk. The $14,824 gap is a model scenario.

Semiconductor ETF Dollar Cost Averaging: Costly 3-Year Wait? Read More »

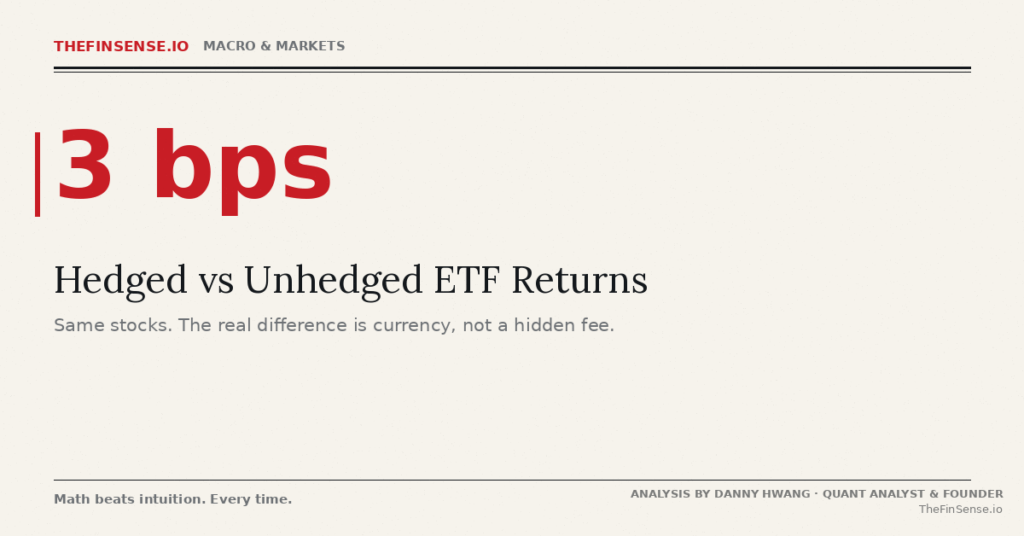
Hedged vs Unhedged ETF Returns: a 3-basis-point net expense-ratio difference in the June 30, 2026 fact sheets; currency exposure drives the broader comparison.

Hedged vs Unhedged ETF Returns: Currency Risk, Fees and Scenarios

Part 4: Macro and Markets

Currency exposure drives the HEFA-versus-EFA comparison. Separate dated fund fees from hypothetical trading-cost assumptions and modeled long-term gaps.

Hedged vs Unhedged ETF Returns: Currency Risk, Fees and Scenarios Read More »

Why Emerging Markets Underperform: 15 Markets, 1 Growth Trap

Part 4: Macro and Markets

Why emerging markets underperform despite GDP growth: compare 15 markets and see how share dilution can keep economic growth from reaching shareholders.

Why Emerging Markets Underperform: 15 Markets, 1 Growth Trap Read More »

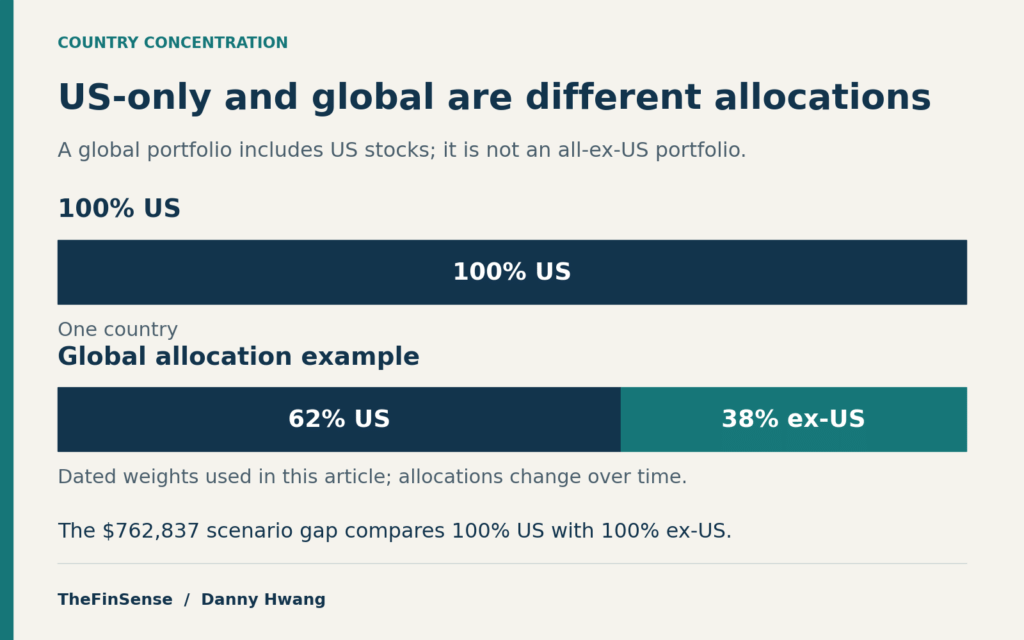
100% US compared with the article’s dated global allocation example of 62% US and 38% ex-US; the $762,837 model compares two pure regional sleeves

100% US vs Global Portfolio: What Diversification Changes

Part 4: Macro and Markets

Compare US-only, all-ex-US, and global portfolio scenarios without mistaking historical averages for forecasts. The foreign-leading case is hypothetical and the developed/emerging comparison uses a different market split.

100% US vs Global Portfolio: What Diversification Changes Read More »

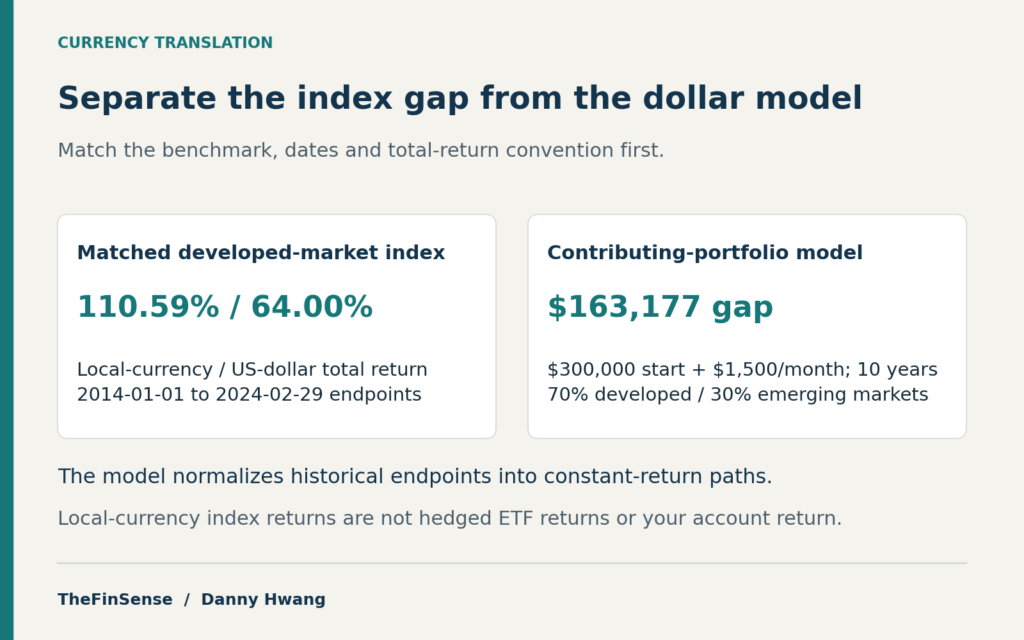
Matched local-currency and USD index endpoints are separate from the $163,177 contributing-portfolio model, with its stated cash flows and ten-year normalization

Strong Dollar and International ETFs: 2 Costly Return Gaps

Part 4: Macro and Markets

A strong dollar can shrink international ETF returns. Compare two MSCI indexes in local currency and dollars, then test the model’s hedging-cost assumptions.

Strong Dollar and International ETFs: 2 Costly Return Gaps Read More »

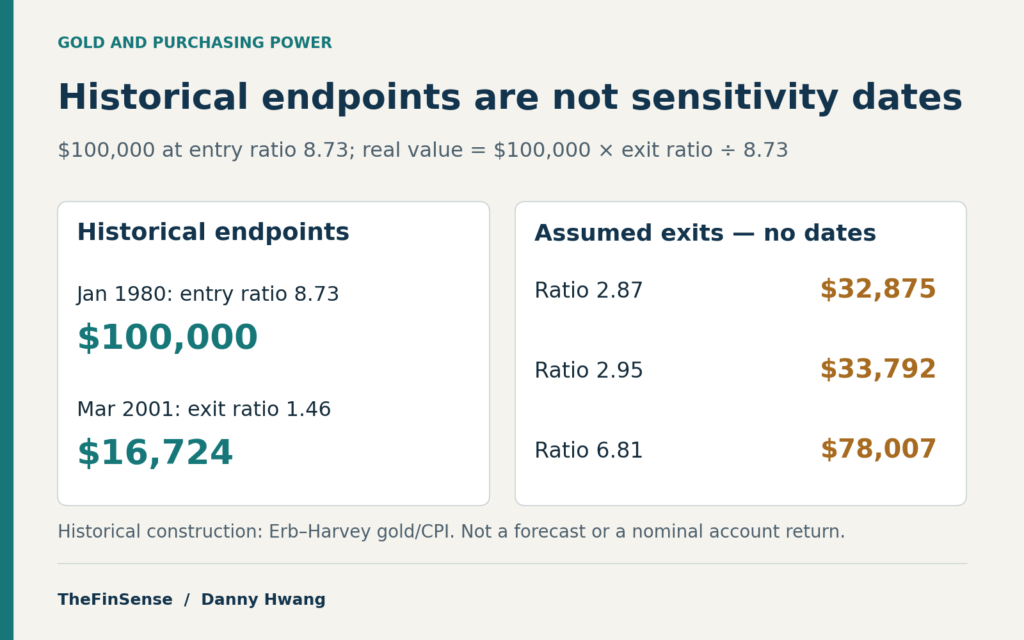
Gold/CPI historical endpoints in January 1980 and March 2001 are separated from assumed exit ratios 2.87, 2.95 and 6.81, which carry no calendar dates

Is Gold an Inflation Hedge? The Costly 1980 Lesson

Part 4: Macro and Markets

Is gold an inflation hedge? The 1980 real-price peak led to a decades-long purchasing-power decline. Test the endpoints and see where protection fails.

Is Gold an Inflation Hedge? The Costly 1980 Lesson Read More »

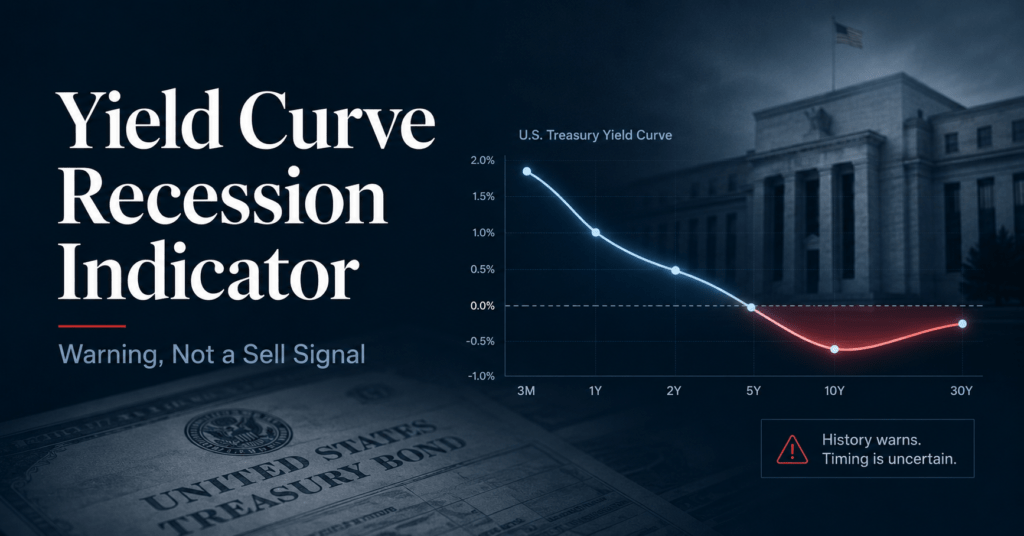
Yield curve recession indicator showing short Treasury yields above long Treasury yields

Yield Curve Recession Indicator: Warning, Not a Sell Signal

Part 4: Macro and Markets

The yield curve recession indicator has flagged every US recession in sixty years, yet selling at inversion skipped a 28.8% rally.

Yield Curve Recession Indicator: Warning, Not a Sell Signal Read More »

Business cycle investing sector rotation across expansion and recession

Business Cycle Investing: Why Sector Rotation Is Hard to Trade

Part 4: Macro and Markets

Even with perfect foresight, business cycle investing beat the market by at most 2.3% a year from 1948 to 2007, and real costs erase it. Here is what works.

Business Cycle Investing: Why Sector Rotation Is Hard to Trade Read More »

← Previous 1 2 3 4 … 10 Next →
A close-up image of stacked coins with a blurred clock, symbolizing time and money relationship.
#image_title

RECENT POSTS

  • Backdoor Roth Pro-Rata Rule: Calculate the Taxable Amount
  • Roth IRA 5-Year Rule: Which Withdrawals Can Trigger Tax?
  • Traditional IRA Deduction Limits: Income, Workplace Plans, and Partial Deductions
  • Roth IRA MAGI: Is Your Income Really Too High?
  • IRA Contribution Limits for 2026: How Much Can You Contribute?

CATEGORIES

  • Part 1: Wealth Foundations (52)
  • Part 2: Stock Screening & Analysis (13)
  • Part 3: Trading Edge (11)
  • Part 4: Macro and Markets (11)
  • Part 5: Sectors, Themes & Alternatives (3)
  • Research (1)
  • Uncategorized (2)

TheFinSense

10 BusanDaeHak Ro, Busan,
GyeongSangNam Do, South Korea

Company

  • About TheFinSense
  • Contact TheFinSense
  • Privacy Policy
  • Cookie Policy | TheFinSense
  • Editorial Policy

© 2026 TheFinSense. Educational content only. Not investment, tax, or legal advice.

Manage Consent
To provide the best experiences, we use technologies like cookies to store and/or access device information. Consenting to these technologies will allow us to process data such as browsing behavior or unique IDs on this site. Not consenting or withdrawing consent, may adversely affect certain features and functions.
Functional Always active
The technical storage or access is strictly necessary for the legitimate purpose of enabling the use of a specific service explicitly requested by the subscriber or user, or for the sole purpose of carrying out the transmission of a communication over an electronic communications network.
Preferences
The technical storage or access is necessary for the legitimate purpose of storing preferences that are not requested by the subscriber or user.
Statistics
The technical storage or access that is used exclusively for statistical purposes. The technical storage or access that is used exclusively for anonymous statistical purposes. Without a subpoena, voluntary compliance on the part of your Internet Service Provider, or additional records from a third party, information stored or retrieved for this purpose alone cannot usually be used to identify you.
Marketing
The technical storage or access is required to create user profiles to send advertising, or to track the user on a website or across several websites for similar marketing purposes.

  • Manage options
  • Manage services
  • Manage {vendor_count} vendors
  • Read more about these purposes
View preferences
  • {title}
  • {title}
  • {title}