Skip to content
TheFinSense
Search
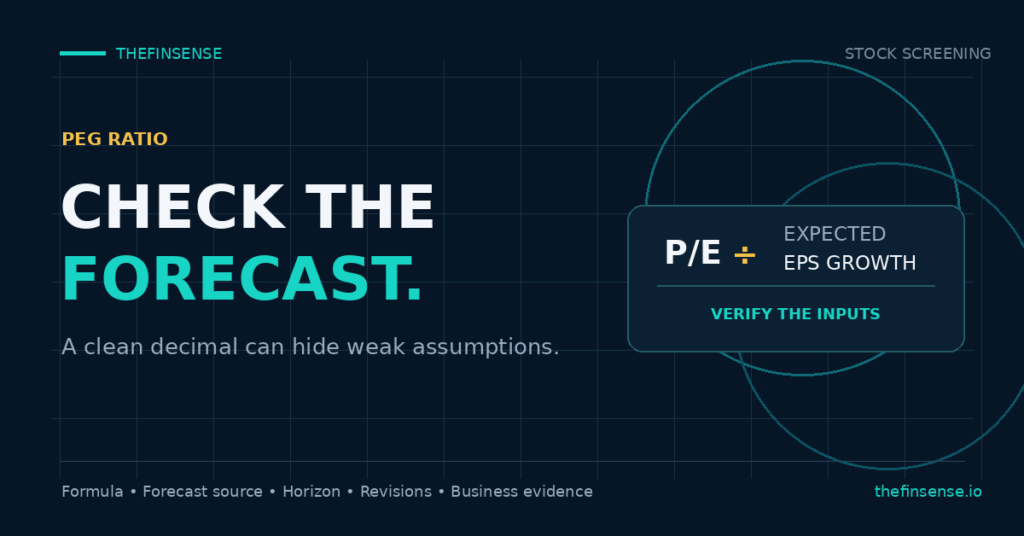
PEG ratio formula showing P/E divided by expected EPS growth with a reminder to verify forecast inputs

PEG Ratio: Why a Low Number Can Still Mislead You

Part 2: Stock Screening & Analysis

A low PEG can look precise while hiding stale or mismatched growth assumptions. This guide shows how to check the formula, revisions, and business evidence before relying on the screen.

PEG Ratio: Why a Low Number Can Still Mislead You Read More »
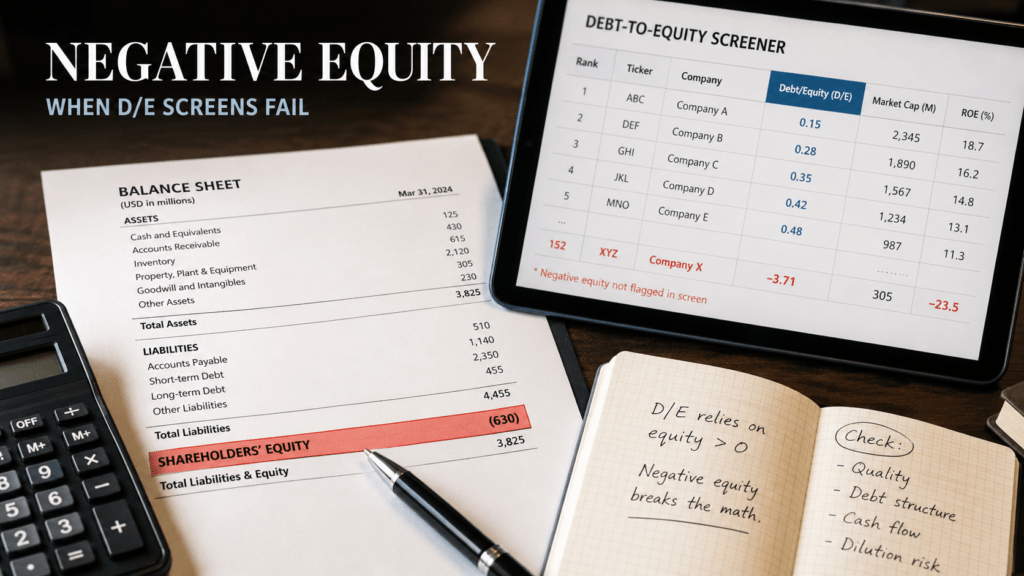
Negative book equity in an S&P 500 debt-to-equity screening analysis

Negative Book Equity: When Debt-to-Equity Stops Comparing Cleanly

Research

Understand zero and negative book equity, apply a three-regime E/A classifier to one filing, and inspect cash flow and debt service before interpreting a leverage rank.

Negative Book Equity: When Debt-to-Equity Stops Comparing Cleanly Read More »

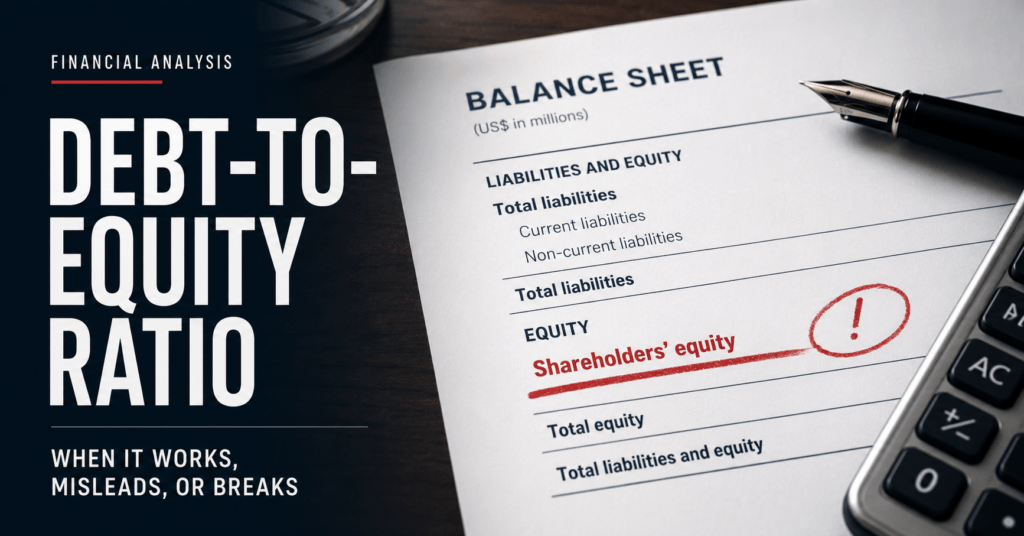
Debt-to-equity ratio graphic beside a balance sheet with shareholders' equity highlighted

Debt-to-Equity Ratio: When It Works, Misleads, or Breaks

Part 2: Stock Screening & Analysis

The debt-to-equity ratio stops being a comparison tool once shareholders’ equity crosses zero. A three-regime ladder replaces the single-scale reflex.

Debt-to-Equity Ratio: When It Works, Misleads, or Breaks Read More »

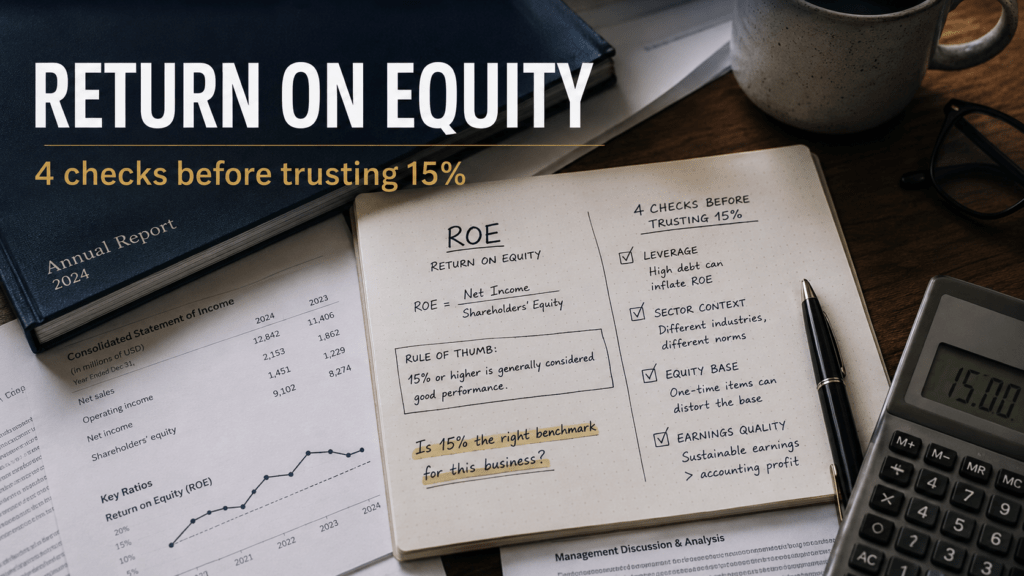
Return on equity analysis with four checks for leverage, sector, negative equity, and earnings quality

Return on Equity: 4 Checks Before You Trust a High ROE

Part 2: Stock Screening & Analysis

Calculate ROE, then check the equity base, leverage, sector benchmark, and earnings quality. A high ratio can come from a shrinking denominator rather than stronger business performance.

Return on Equity: 4 Checks Before You Trust a High ROE Read More »

Adjusted P/E ratio research showing why analysts compare P/E with enterprise-value multiples

Adjusted P/E Ratio: When Reported P/E Misleads

Part 2: Stock Screening & Analysis

Reported P/E can mislead when excess cash, unusual earnings, or capital structure distort the comparison. Use the cash-adjusted P/E calculator to test the adjustment, then compare the result with the right valuation multiple.

Adjusted P/E Ratio: When Reported P/E Misleads Read More »

Cash flow statement analysis comparing reported profit with operating cash flow

Cash Flow Statement Analysis: How to Read Profit vs. Cash

Part 2: Stock Screening & Analysis

Accrual accounting lets profitable companies hide cash deterioration. Adding one cash flow ratio to screening raises failure prediction from 76.7% to 82.9% — a blind spot that compounds to $264,728 over 30 years. Run the 4-step diagnostic in 18 minutes.

Cash Flow Statement Analysis: How to Read Profit vs. Cash Read More »

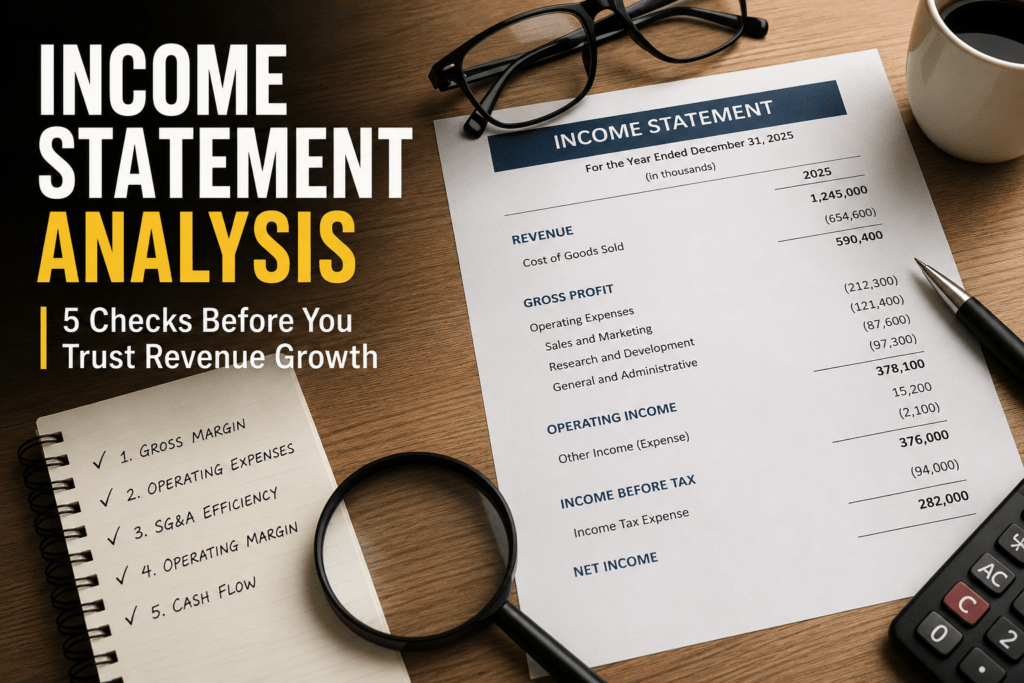
Income statement analysis comparing revenue growth, gross margin, operating expenses, and operating margin

Income Statement Analysis: 5 Checks Before You Trust Revenue Growth

Part 2: Stock Screening & Analysis

SG&A rises 0.55% per 1% sales increase — but falls only 0.35% per 1% decrease. The 0.20pp asymmetry compounds one revenue miss into a $100,340 gap over 30 years. Five signals catch it before the headline resolves.

Income Statement Analysis: 5 Checks Before You Trust Revenue Growth Read More »

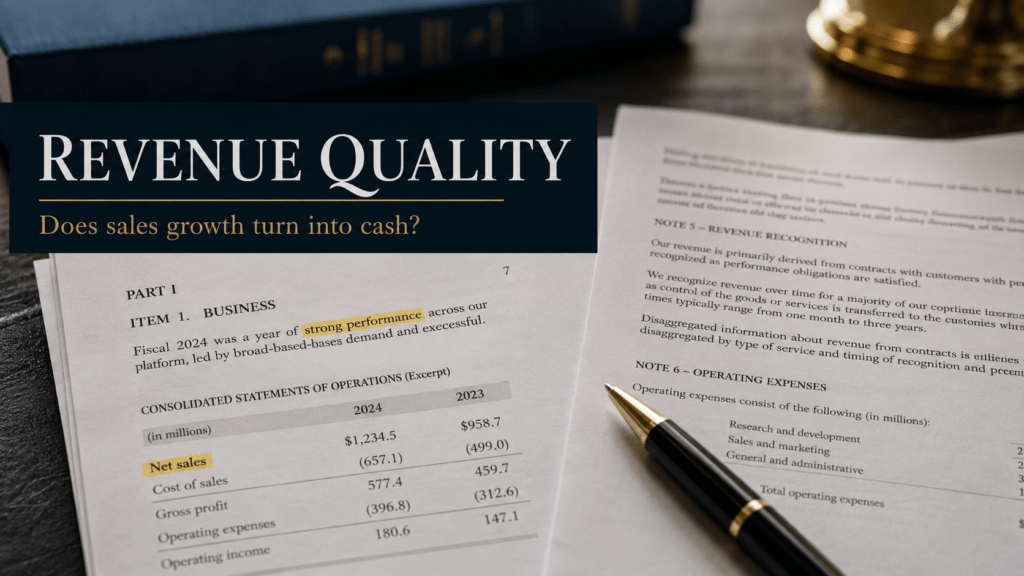
Revenue growth quality check comparing sales, cash flow, receivables, DSO, and deferred revenue in a 10-K

Revenue Growth Quality: How to Tell If Sales Are Turning Into Cash

Part 2: Stock Screening & Analysis

Revenue growth screened without accrual quality carries an 18.0% repricing risk across 108,617 firm-year observations. A single repricing event on an $80,000 position compounds to $109,616 over 30 years. Five signals from one 10-K close the gap in under 10 minutes.

Revenue Growth Quality: How to Tell If Sales Are Turning Into Cash Read More »

Altman Z-Score Calculator for comparing company bankruptcy risk models

Altman Z-Score Calculator: Choose the Right Model for Bankruptcy Risk

Part 2: Stock Screening & Analysis

Choose the Altman model for the company, prepare consistent filing inputs, and use a worked example to interpret bankruptcy risk without treating the score as odds.

Altman Z-Score Calculator: Choose the Right Model for Bankruptcy Risk Read More »

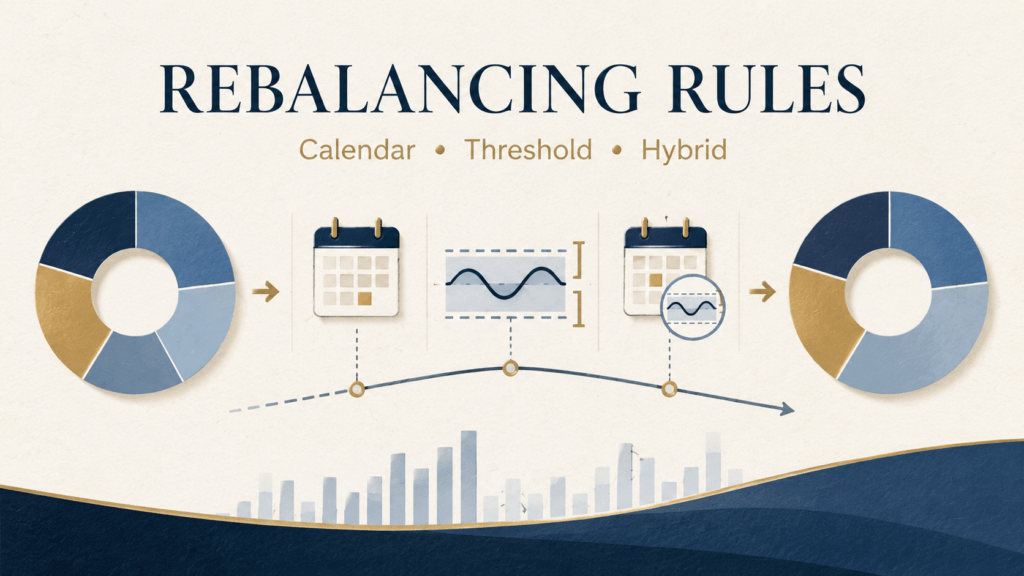
Portfolio rebalancing strategy comparison of calendar, threshold, and hybrid rules

Portfolio Rebalancing Strategy: Calendar, Threshold, or Hybrid?

Part 1: Wealth Foundations

Monthly calendar rebalancing costs $68,195 more than a 5% threshold strategy over 30 years. One account setting drives the entire gap.

Portfolio Rebalancing Strategy: Calendar, Threshold, or Hybrid? Read More »

← Previous 1 … 5 6 7 … 10 Next →
A close-up image of stacked coins with a blurred clock, symbolizing time and money relationship.
#image_title

RECENT POSTS

  • Backdoor Roth Pro-Rata Rule: Calculate the Taxable Amount
  • Roth IRA 5-Year Rule: Which Withdrawals Can Trigger Tax?
  • Traditional IRA Deduction Limits: Income, Workplace Plans, and Partial Deductions
  • Roth IRA MAGI: Is Your Income Really Too High?
  • IRA Contribution Limits for 2026: How Much Can You Contribute?

CATEGORIES

  • Part 1: Wealth Foundations (52)
  • Part 2: Stock Screening & Analysis (13)
  • Part 3: Trading Edge (11)
  • Part 4: Macro and Markets (11)
  • Part 5: Sectors, Themes & Alternatives (3)
  • Research (1)
  • Uncategorized (2)

TheFinSense

10 BusanDaeHak Ro, Busan,
GyeongSangNam Do, South Korea

Company

  • About TheFinSense
  • Contact TheFinSense
  • Privacy Policy
  • Cookie Policy | TheFinSense
  • Editorial Policy

© 2026 TheFinSense. Educational content only. Not investment, tax, or legal advice.

Manage Consent
To provide the best experiences, we use technologies like cookies to store and/or access device information. Consenting to these technologies will allow us to process data such as browsing behavior or unique IDs on this site. Not consenting or withdrawing consent, may adversely affect certain features and functions.
Functional Always active
The technical storage or access is strictly necessary for the legitimate purpose of enabling the use of a specific service explicitly requested by the subscriber or user, or for the sole purpose of carrying out the transmission of a communication over an electronic communications network.
Preferences
The technical storage or access is necessary for the legitimate purpose of storing preferences that are not requested by the subscriber or user.
Statistics
The technical storage or access that is used exclusively for statistical purposes. The technical storage or access that is used exclusively for anonymous statistical purposes. Without a subpoena, voluntary compliance on the part of your Internet Service Provider, or additional records from a third party, information stored or retrieved for this purpose alone cannot usually be used to identify you.
Marketing
The technical storage or access is required to create user profiles to send advertising, or to track the user on a website or across several websites for similar marketing purposes.
  • Manage options
  • Manage services
  • Manage {vendor_count} vendors
  • Read more about these purposes
View preferences
  • {title}
  • {title}
  • {title}