
📅 Originally Published: · Last Updated:
Round-number support and resistance can attract trading, but a familiar price does not guarantee a bounce. Large U.S. transaction data confirms that trades cluster at whole-dollar prices. Older research also finds short-term return patterns under specific conditions. Neither gives you a universal chance that $100 will hold. Before placing an order, decide the price you can accept, the loss you can bear, and what you will do if the order never fills.
A stock falls toward $100, where you have seen it bounce before. Buying at $99.99 feels a little smarter than joining everyone at $100, but the goal matters. Are you counting on a bounce, trying to buy for less, or hoping to get ahead of other buyers? Each choice needs a different reason.
Support is a price area where buying may slow a decline. Resistance is an area where selling may slow a rise. Round numbers can draw attention to either, but a familiar number does not tell you how much buying or selling will be there this time.
This guide examines support and resistance at round-number levels in stocks. It separates what research says about trading at those prices from what you still need to know before using one as an entry or exit.
What Support and Resistance Research Shows
Bloomfield, Chin, and Craig analyzed U.S. stock trading from July 2019 through June 2020. Their April 2025 working paper reports a dataset with 134,066,741 transactions and 20,798,516 accounts. Trades occurred at whole-dollar prices much more often than an even spread across cent endings would suggest.
| Ending | Observed share | Uniform baseline | Comparison |
|---|---|---|---|
| Whole dollars, such as $100.00 | 3.73% | 1.00% | 3.73 times the baseline |
| Whole dollars or 50 cents | 5.64% | 2.00% | 2.82 times the baseline |
| Final cent digit of 0 or 5 | 21.34% | 20.00% | 6.7% above the baseline |
These categories overlap; do not add their shares. The baselines assume each of the 100 cent endings is equally likely. The 50-cent category includes .00 and .50. The last row means prices such as $100.05, $100.10, and $100.15, not just .00 and .05. Its relative excess is (21.34 ÷ 20) − 1 = 6.7%, or 1.34 percentage points.
Source: Bloomfield, Chin, and Craig, The Allure of Round Number Prices for Individual Investors, revised April 2025.
The first row combines prices ending in .00 across the sample, so it does not say that trading at $100 alone was 3.73 times as common, or that this level was more likely to stop a decline.
The paper found more whole-dollar clustering among individuals than institutions. Institutions still showed clustering, and rounding generally rose with stock price, especially at whole-dollar and half-dollar levels.
What the data directly shows is where trades took place. It does not show every waiting order or prove why someone chose a price. Order placement and shared attention are possible explanations, not the same thing as the measured result.
Does a Round Price Predict a Bounce?
The 2025 account study did not measure how often support held or resistance broke. A count of trades at a price cannot answer that question: buying and selling meet in every completed trade.
An older study goes further. Bhattacharya, Holden, and Jacobsen examined more than 100 million transactions in 100 randomly selected U.S. stocks during 2001–2006. They studied buy–sell imbalances and returns over the following 24 hours, including what happened when quotes reached or crossed whole-dollar prices.
Those cases had different results. In the full sample, the authors found positive abnormal trade-price returns for buying when the ask fell to an integer and selling when the bid rose to one. Crossing cases were mixed. Here, “abnormal” means a return relative to the paper’s benchmark at five-cent price points. It does not mean a guaranteed profit.
This matters because reaching a level and falling through it are different events. The paper offers evidence of conditional short-term patterns, but no universal bounce rate. It also warns that the results do not establish arbitrage profits after trading costs.
Source: Bhattacharya, Holden, and Jacobsen, “Penny Wise, Dollar Foolish: Buy-Sell Imbalances On and Around Round Numbers”, Management Science, 2012, section 6.
The often-quoted $813 million per year comes from this older paper. It is a rough estimate of market-wide wealth transfers associated with buys below and sells above round prices, scaled from the sample. The authors averaged about $1.02 billion using returns based on executed trades and $606 million using returns based on quote midpoints. It is a historical estimate, not today’s annual cost or a loss you can assign to each investor.
A price level can therefore deserve attention without earning an automatic trade. To test a bounce rule, you still need to define the touch, entry, exit, holding period, and costs before seeing the outcome.
Why Round Numbers Attract Traders
“Buy around $50” is easy to remember and easy to turn into an order. Round numbers make decisions simpler to describe. If many traders choose the same reference, others may trade around it.
The 2025 paper found patterns consistent with the ease of using round numbers. Its results did not fit an explanation based only on limited mental capacity. That is a useful limit: choosing a round price does not, by itself, identify an uninformed trader.
The 2012 paper found excess buying just below round prices and excess selling just above them. The authors discuss how traders providing liquidity may respond to these predictable patterns. The observed imbalance does not identify each trader’s knowledge or motive.
Tao Chen’s 2018 study, Round-number biases and informed trading in global markets, reported evidence of round-number bias in 30 of 41 markets. That broadens the evidence beyond U.S. stocks, while leaving room for differences between markets. It is a reason to check the market you trade, rather than assume a pattern holds everywhere.
International evidence: Chen, “Round-number biases and informed trading in global markets”, Journal of Business Research, 2018.
Choosing a Limit Order
Avoiding .00 is not a complete order rule. The direction of the change matters at least as much as whether the price looks round.
Suppose you want to buy and have decided that $100 is your maximum acceptable price. The illustration below shows how the price constraint changes with the order you enter; these are examples, not tested recommendations.
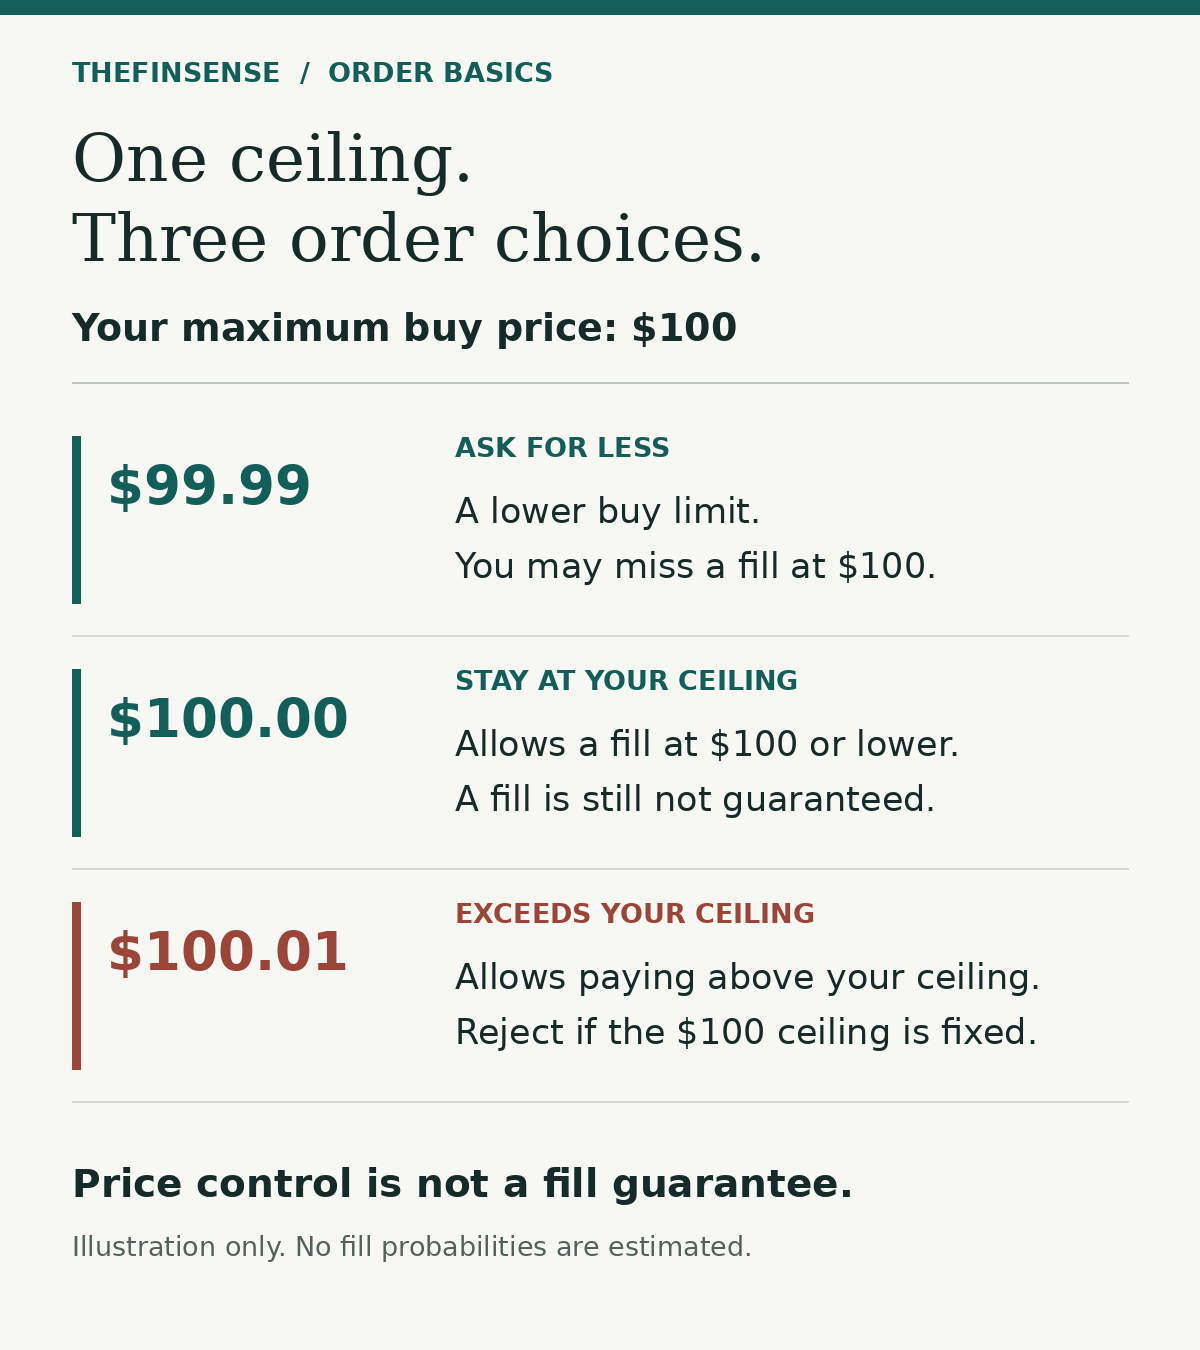
A buy limit can fill at its price or lower. A sell limit can fill at its price or higher. For a seller, raising the limit asks for more money and may miss a sale available at the lower price. Neither side should confuse a preferred price with a promised fill.
Order basics: Investor.gov’s guide to order types explains buy and sell limit prices.
A more competitive limit price may help an order, but the result also depends on available shares, timing, venue, and competing orders. Even a trade printed at your limit does not prove your own order should have filled.
The older research gives a reason to examine non-round thresholds and orders around clusters. It does not justify moving every order by a fixed number of cents. Start with the price you can accept and how urgently you need the trade.
Before You Trade the Level
First decide what job the level is doing, because a reference on a chart, an order price, and a trading signal need different evidence. The next step should match the claim you plan to act on.
| Your question | What to check next |
|---|---|
| Will a whole-dollar price draw activity? | Clustering is documented across the sample. Check current liquidity rather than assuming every integer has the same crowd. |
| Will this level hold? | Define what it means for a support or resistance level to hold, and over what period. Test that rule; a transaction count is not a success rate. |
| Should I change my limit price? | Compare the acceptable price, urgency, and risk of no fill. Check whether your change makes the order more or less competitive. |
| Where should I draw the support zone? | Fix the zone and the failure condition before the next move. Do not widen or redraw it just to preserve a successful-looking signal. |
If you trade bounces or breakouts at support and resistance, write the full rule before testing it. Include failed fills, spread, fees, and the exit. Our technical analysis backtest guide explains how to judge a rule on data that did not help create it.
For chart levels chosen by eye, the trendline survivorship-bias guide addresses another problem: the lines that look convincing after a move may not be the ones you could have chosen beforehand.
For a long-term investor, ask whether this decision deserves much attention at all. Fees, taxes, and sticking to an asset allocation can matter more than the last cent on one liquid-stock order. An investment policy statement helps keep a tempting chart level from replacing the portfolio plan.
Common Questions
Does 3.73 times as much trading mean 3.73 times the chance of a bounce?
No: the figure compares whole-dollar transaction frequency with a uniform cent-ending baseline. It does not measure how often support or resistance worked.
Can the price touch my limit without filling my order?
Yes: a displayed trade at your limit is not a guarantee that your own order will fill. Other orders may receive the available shares, and the quote you can trade against may differ from the last traded price.
Are round-number levels useless?
No: they can be useful references, and some historical research finds return patterns under specific conditions. Use separate tests before turning that context into a trading rule.
The Bottom Line
The three lessons for round-number support and resistance are straightforward: trading concentration is not a bounce rate, historical return patterns depend on their conditions, and a limit price does not guarantee a fill. You can mark a round level on a chart without buying there. The evidence gives you a reason to watch round prices; the trade still needs its own reason.
Set your acceptable price, decide when the idea has failed, and plan for no fill. If changing a few cents breaks those rules, keep the rules.
Update history
- v1.2 2026-09-30 UPDATE
Clarified the studies’ findings and sample limits, corrected the Chen citation, added a buy-limit illustration, repaired internal links, and simplified the article.
- v1.1 2026-07-21 UPDATE
Rebuilt the article around the cited studies. Removed the unsupported execution-drag model, fixed cost assumption, universal cent-offset prescription, and mismatched calculator. Corrected the 50-cent baseline and clarified the historical wealth-transfer estimate.
- v1.0 2026-05-04 PUBLISH
Original publication.