Trading EdgeTest the Rule Before You Trade It
A trading signal is only useful after it survives the parts most backtests avoid.
We test technical rules against data-snooping, transaction costs, taxes, and out-of-sample evidence.
Backtest Evidence
Trading Costs
Out-of-Sample Tests
The Survival Test
How We Test a Claimed Trading Edge
A profitable chart in hindsight is not enough. The analysis has to show that the rule was defined before the result, survives realistic execution costs, and continues to work outside the sample that produced it.
01 · Signal
Was the rule defined clearly?
We separate testable entry and exit rules from visual pattern recognition that changes after the chart is already known.
02 · Friction
Does the edge survive implementation?
Turnover, spreads, slippage, taxes, and missed market exposure are included before a gross backtest is called investable.
03 · Survival
Does it work beyond the original sample?
We look for multiple-testing corrections, regime robustness, and out-of-sample evidence rather than rewarding one attractive historical period.
Backtest analysis for education and further research, not a recommendation to trade any signal or security.
Research Library
Latest Trading Edge Analysis
Technical signals, backtest failures, execution costs, market timing rules, and evidence that survives hindsight.
Jun 1, 2026
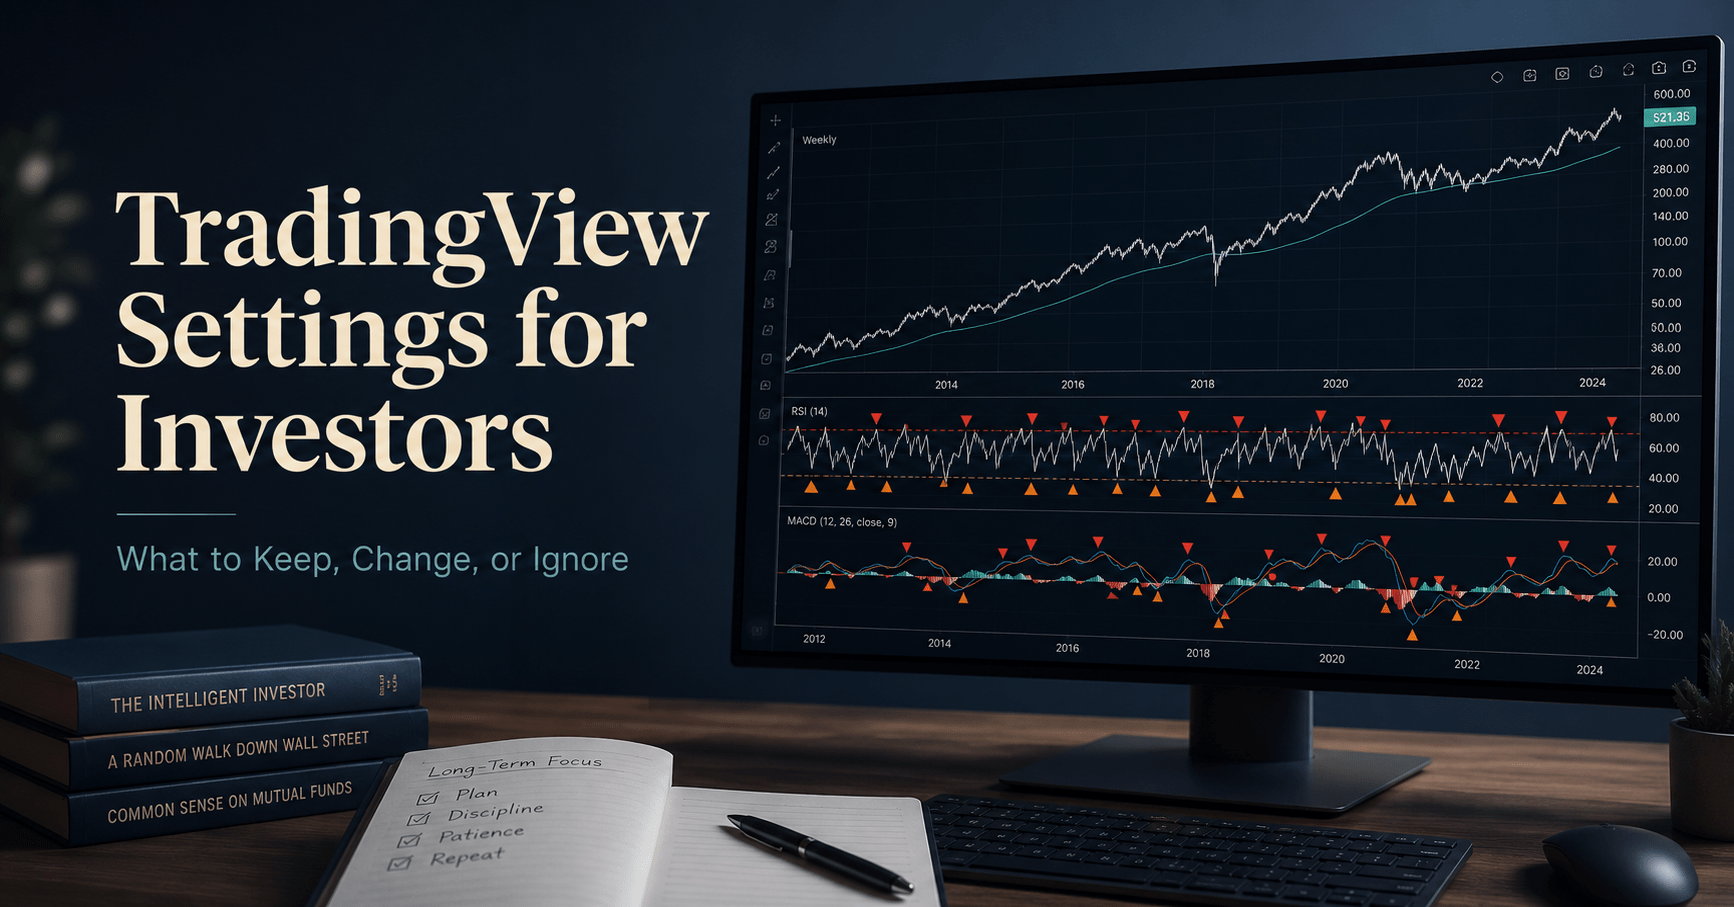
TradingView Settings for Investors: What to Keep, Change, or Ignore
TradingView's default RSI 14 and MACD 12/26/9 are 1970s day-trading numbers. Obey their alerts as a long-term investor and the quiet bill runs about $4,757 a decade.
Read the analysis →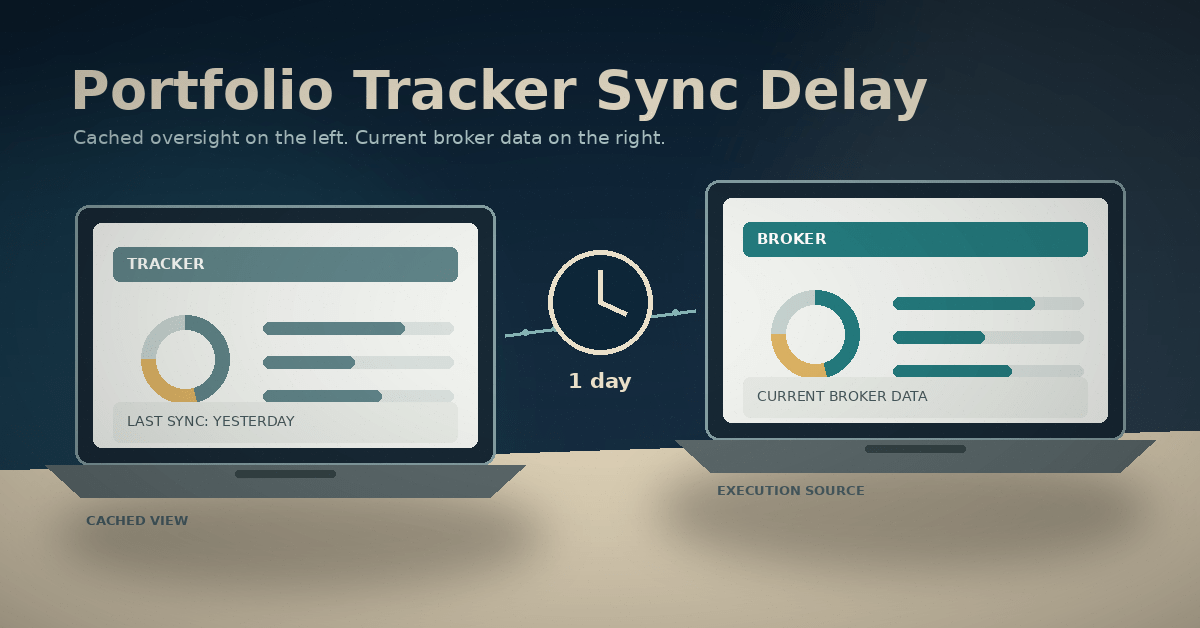
May 25, 2026
Portfolio Tracker Sync Delay: When Fresh Data Actually Matters
We ran 3,000 simulations to price a day-late portfolio tracker. Median 30-year cost: about zero. It adds swing, not a steady drain.
Read the analysis →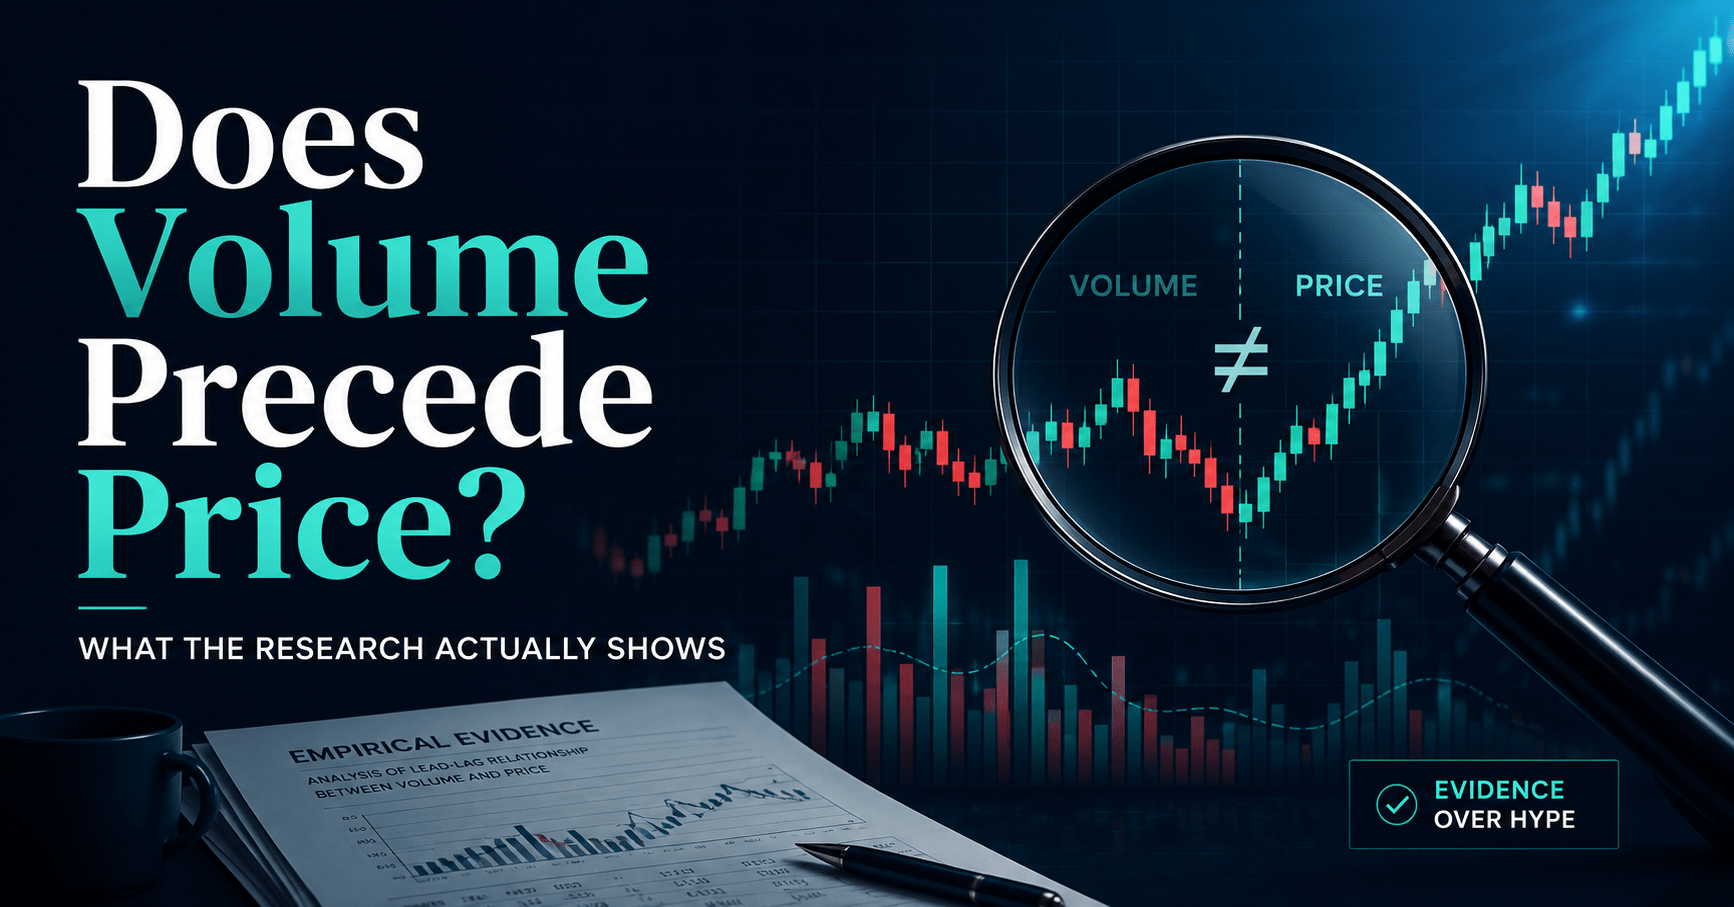
May 22, 2026
Does Volume Precede Price? What the Research Actually Shows
📅 Originally Published: May 21, 2026 · Last Updated: July 23, 2026 Trading volume can add context, but the research reviewed here does not support a universal rule that it…
Read the analysis →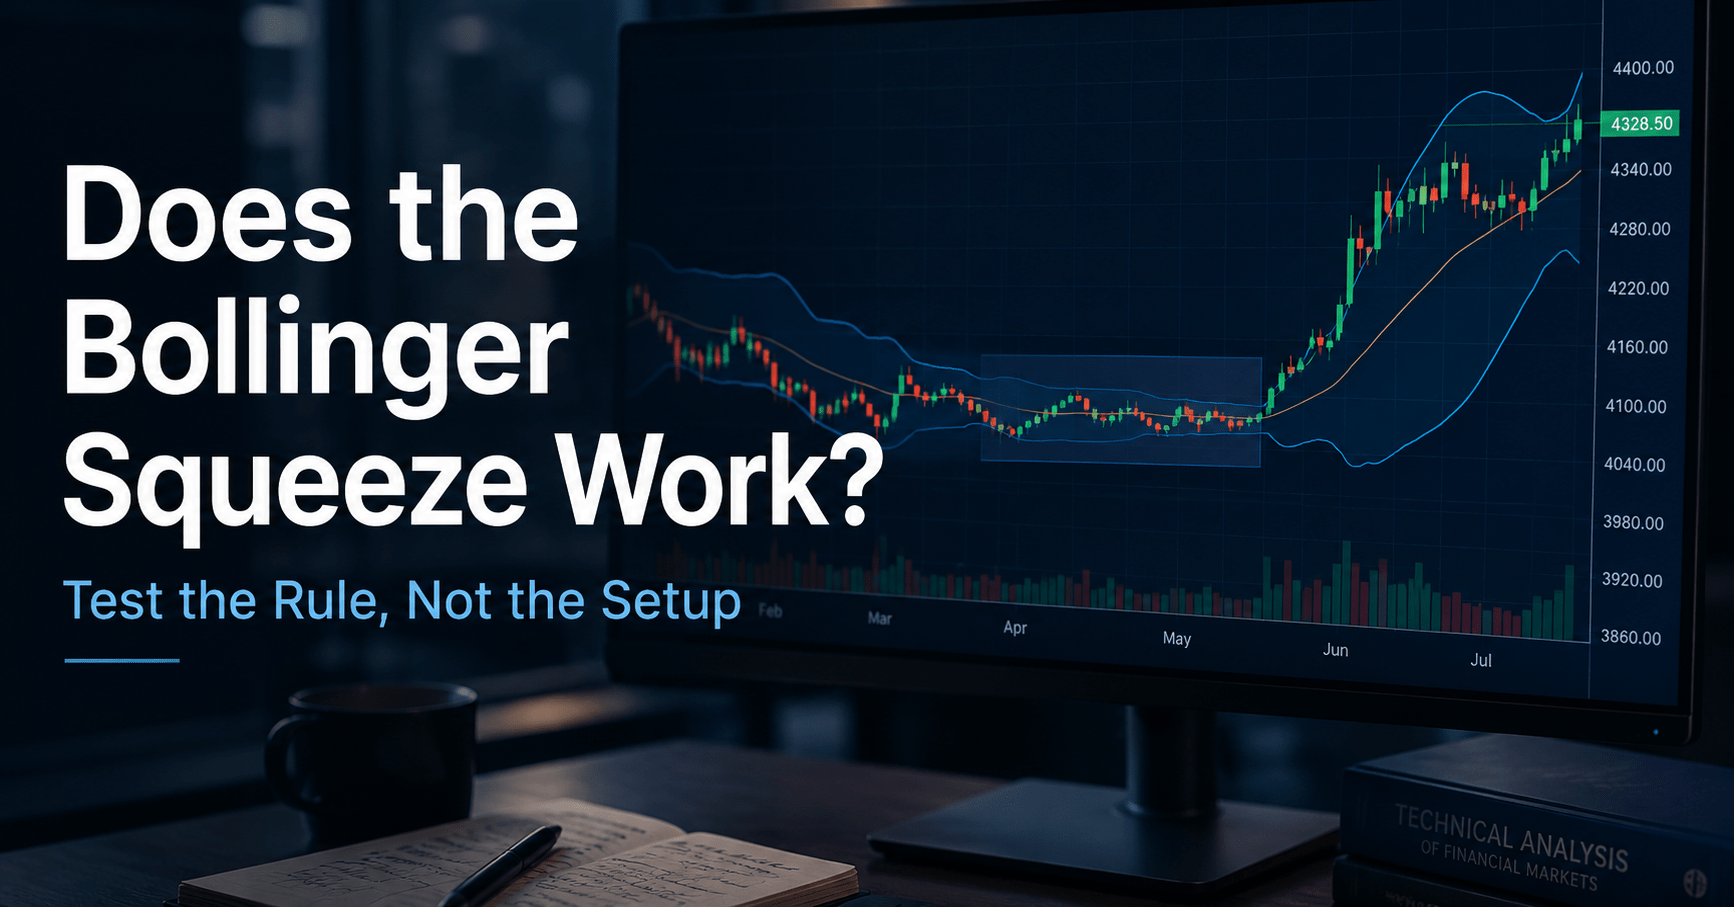
May 19, 2026
Does the Bollinger Squeeze Work? Test the Rule, Not the Setup
Bollinger Band squeeze win rate sits at 50 percent in academic tests of 7,846 trading rules. The compound cost on a $50,000 account over 15 years reaches $26,328.
Read the analysis →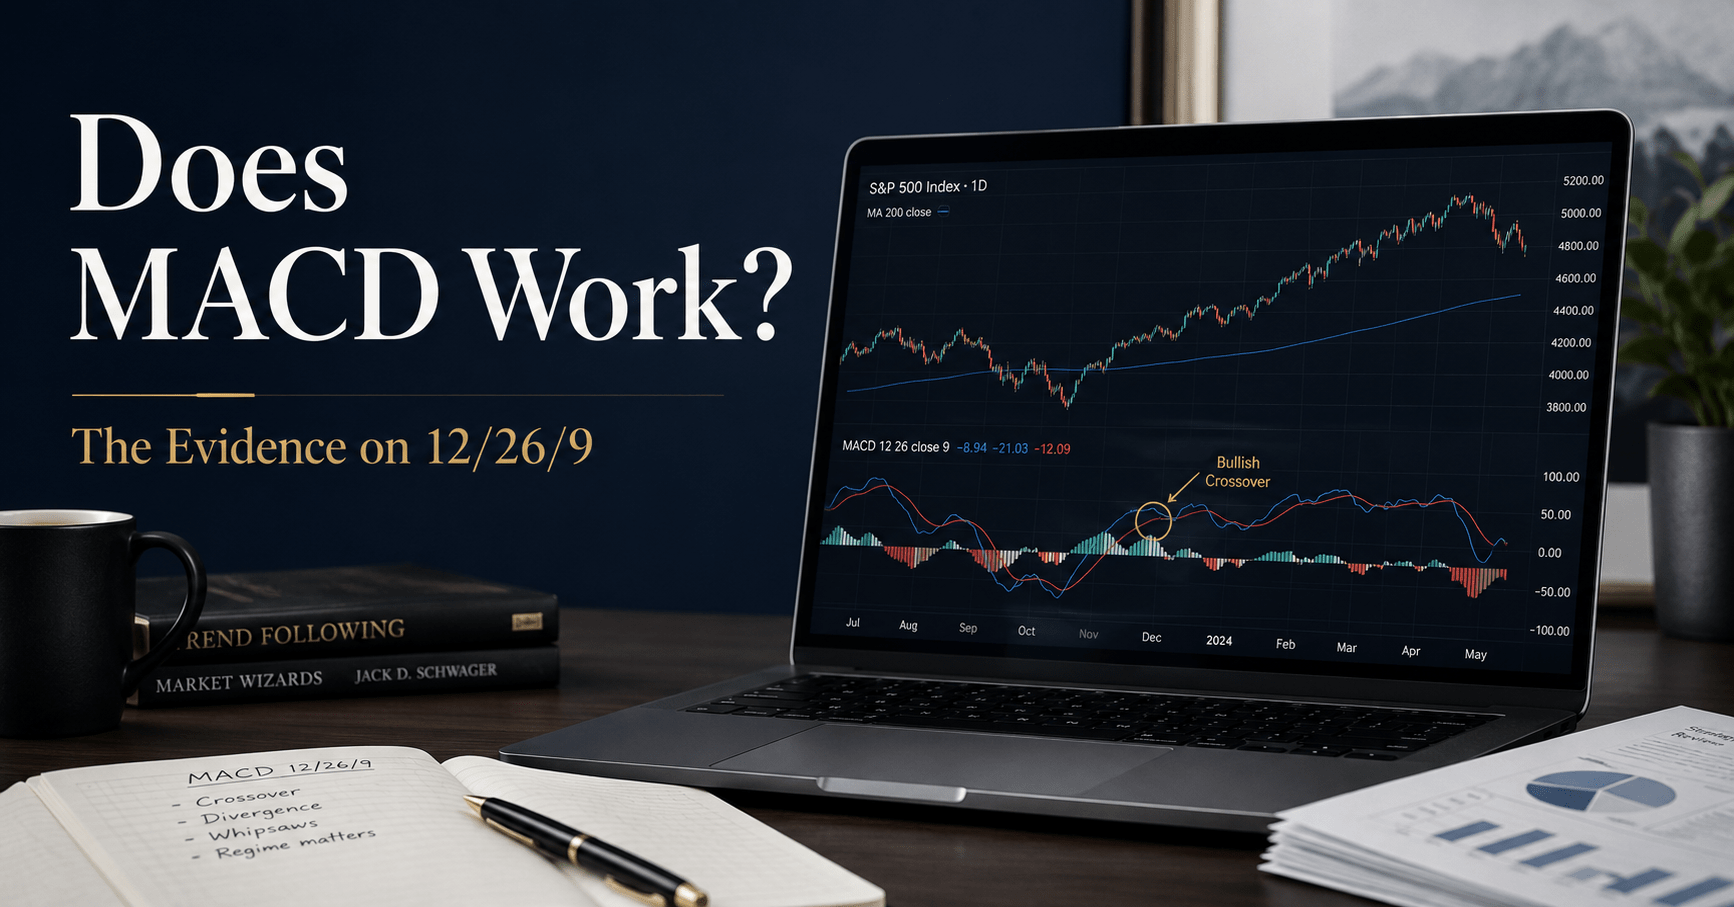
May 16, 2026
Does MACD Work? What the Evidence Says About 12/26/9
The common 12/26/9 MACD setting is easy to add to a chart, but the evidence does not support treating it as a universal trading edge.
Read the analysis →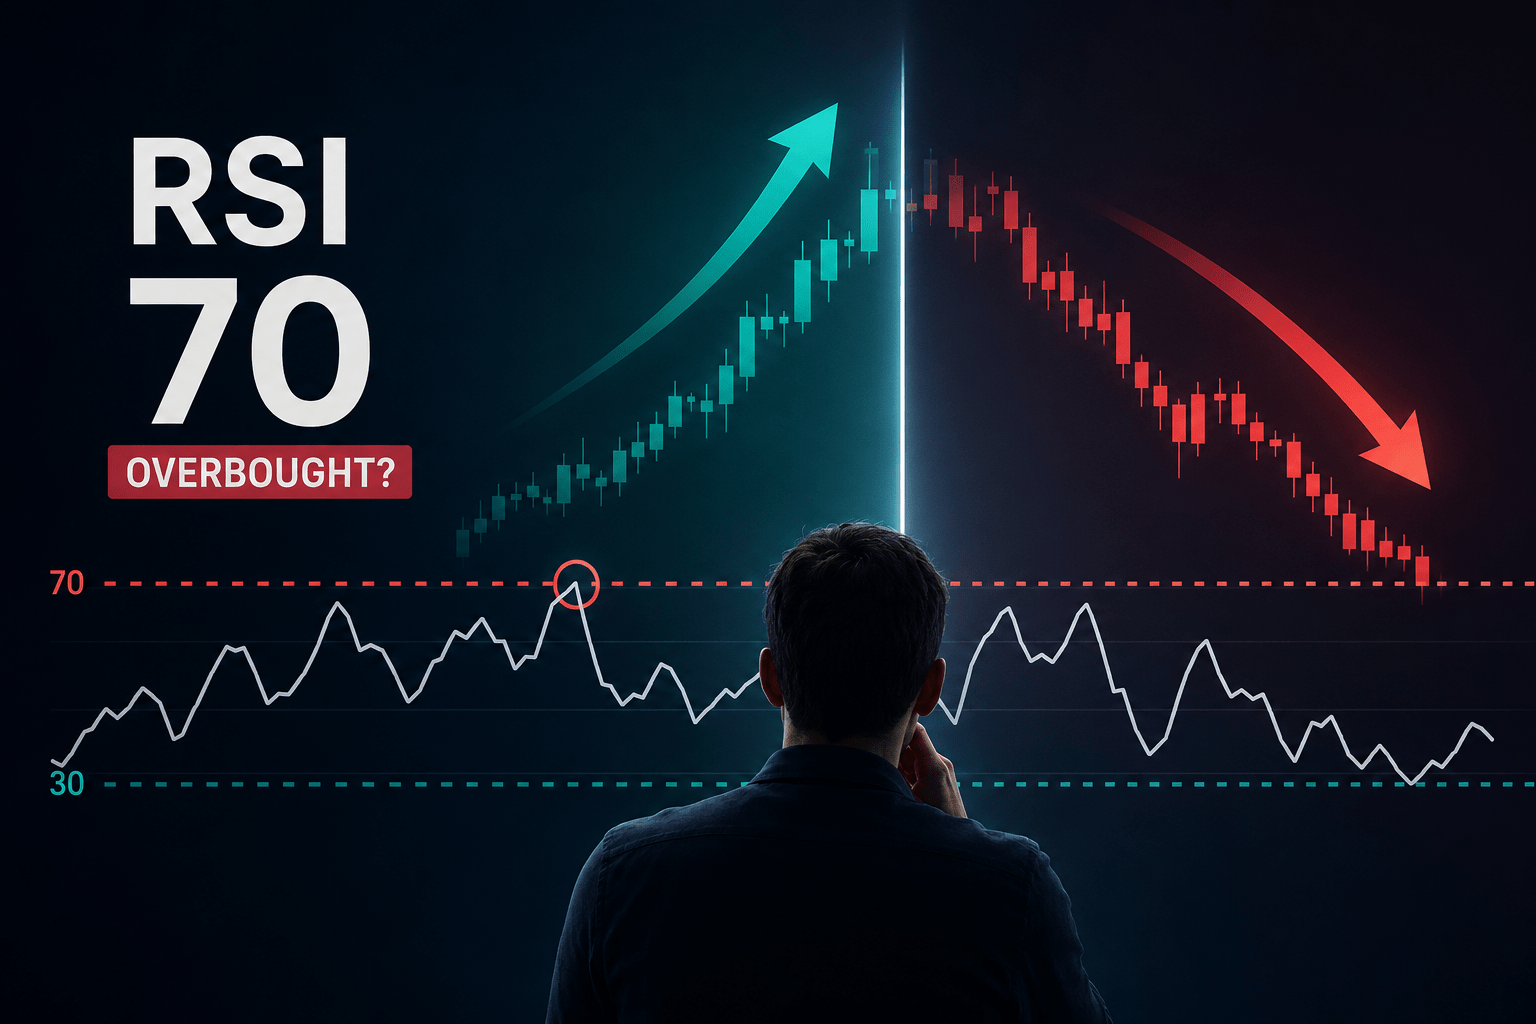
May 13, 2026
RSI Overbought Signal: Why 70 Is Not an Automatic Sell
An RSI overbought signal above 70 shows unusually strong recent momentum. It does not, by itself, tell you to sell
Read the analysis →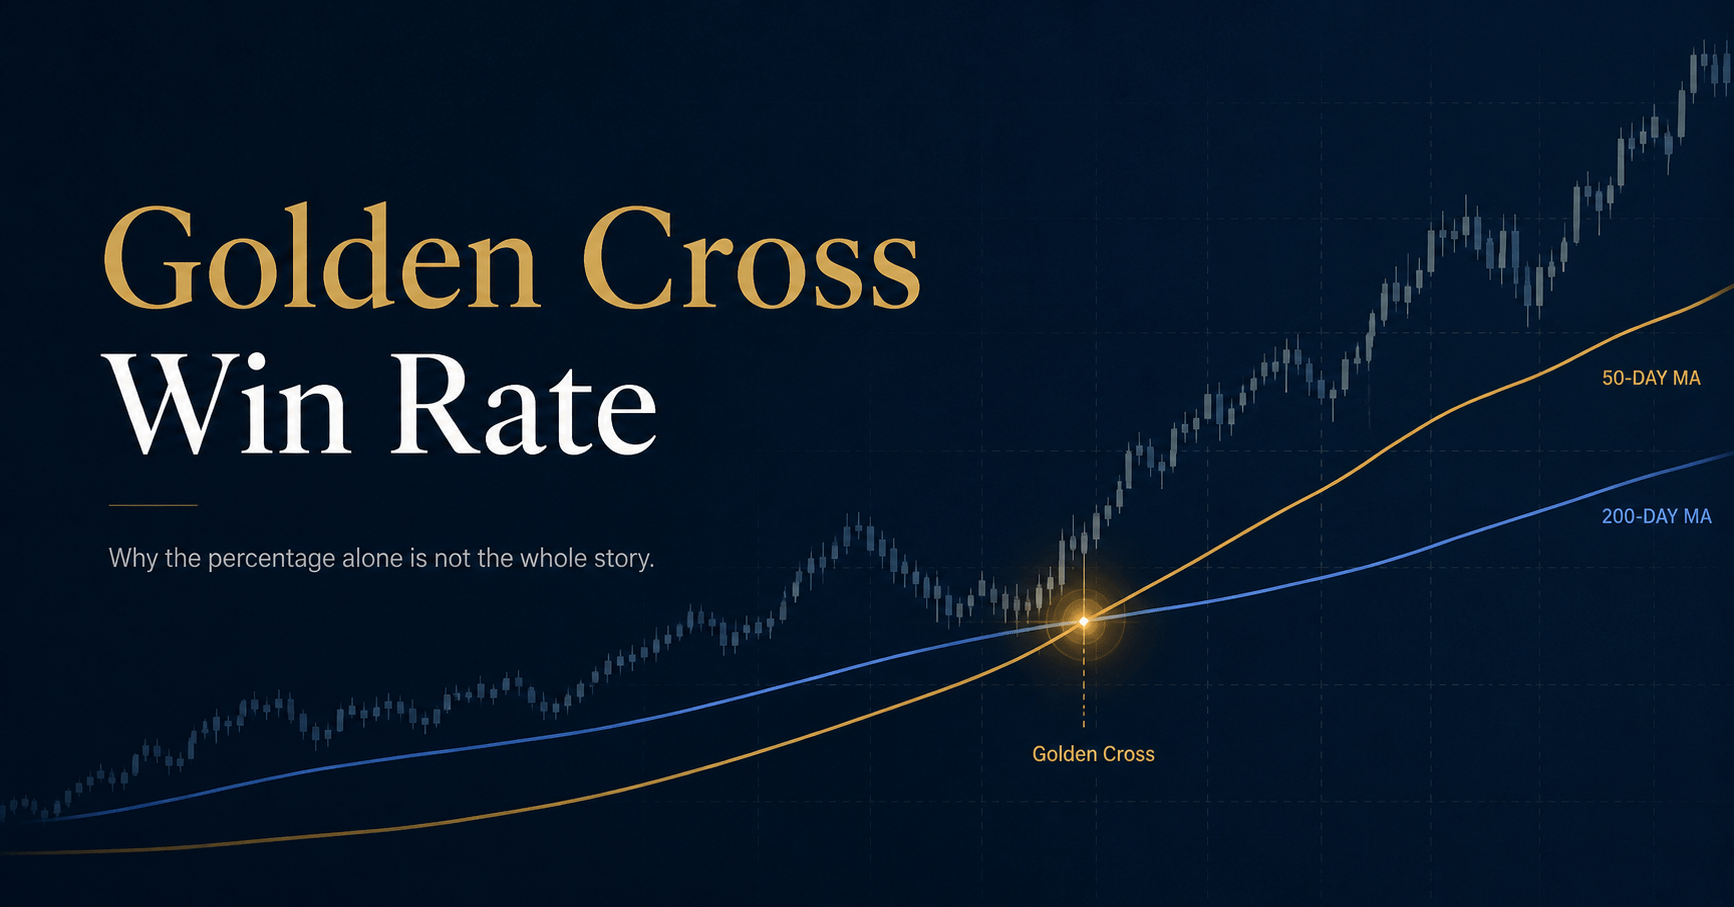
May 11, 2026
Golden Cross Win Rate: What the Percentage Misses
A 78 percent golden cross win rate is a frequency claim, not a wealth claim. QuantifiedStrategies' 33-signal S&P 500 backtest from 1960 through 2026 logs the 78 percent figure alongside…
Read the analysis →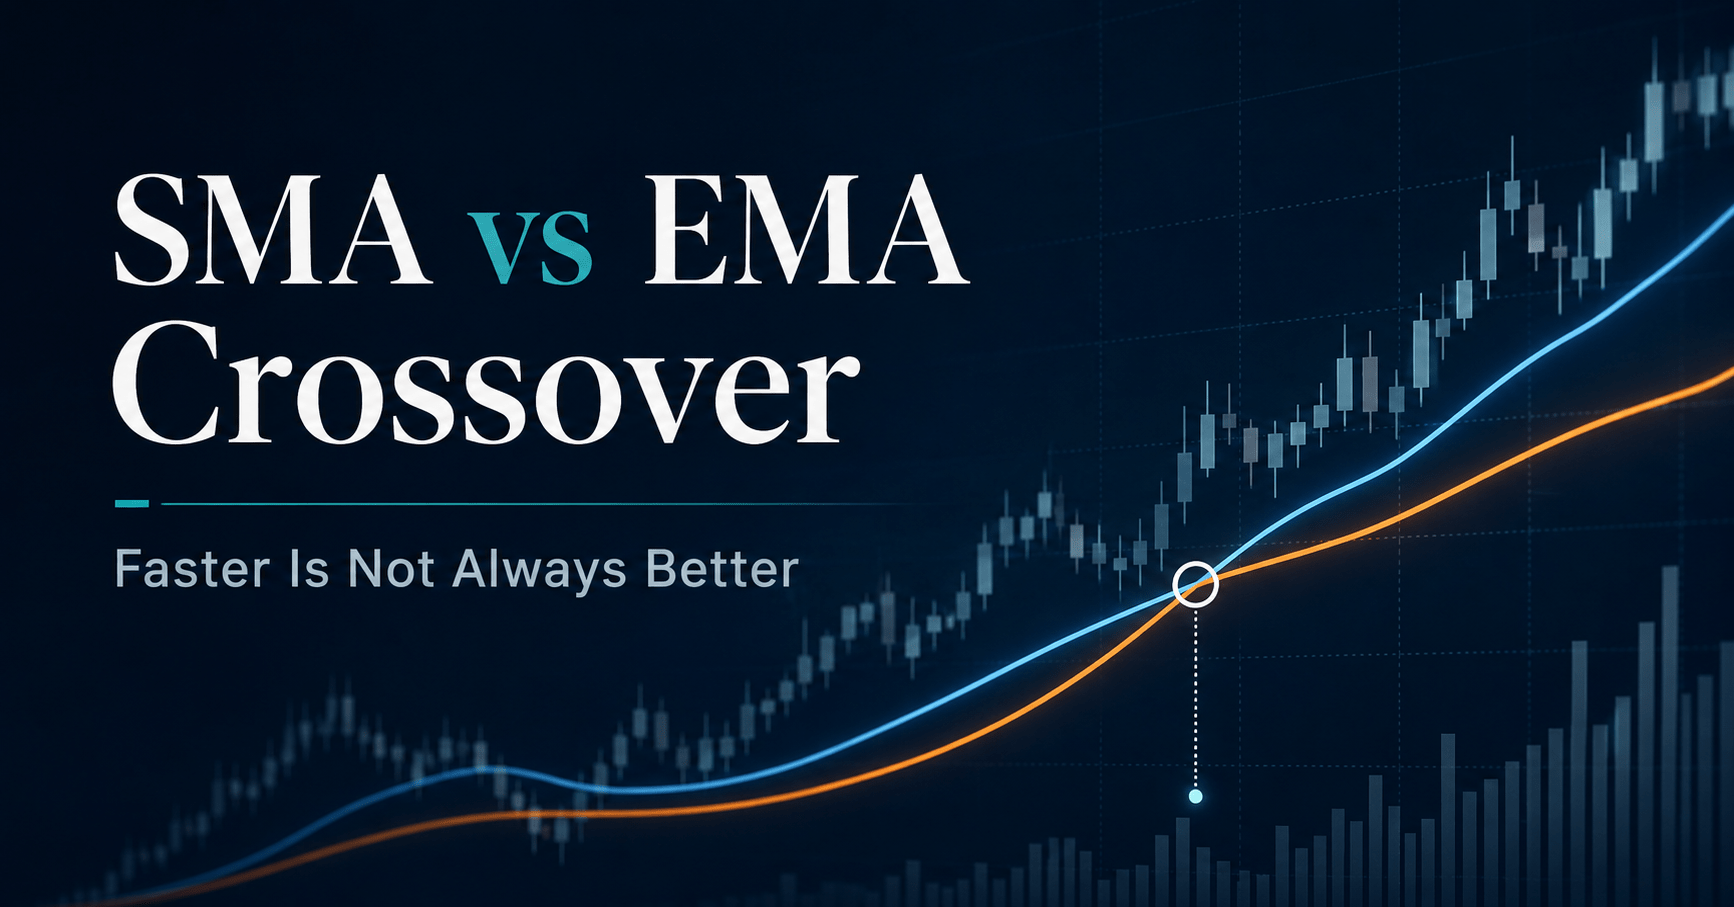
May 8, 2026
SMA vs EMA Crossover: Faster Is Not Always Better
Barber and Odean's Q4 turnover quintile costs 5.568 percent yearly across 66,465 households. That drag attaches to trade frequency, not signal smoothness.
Read the analysis →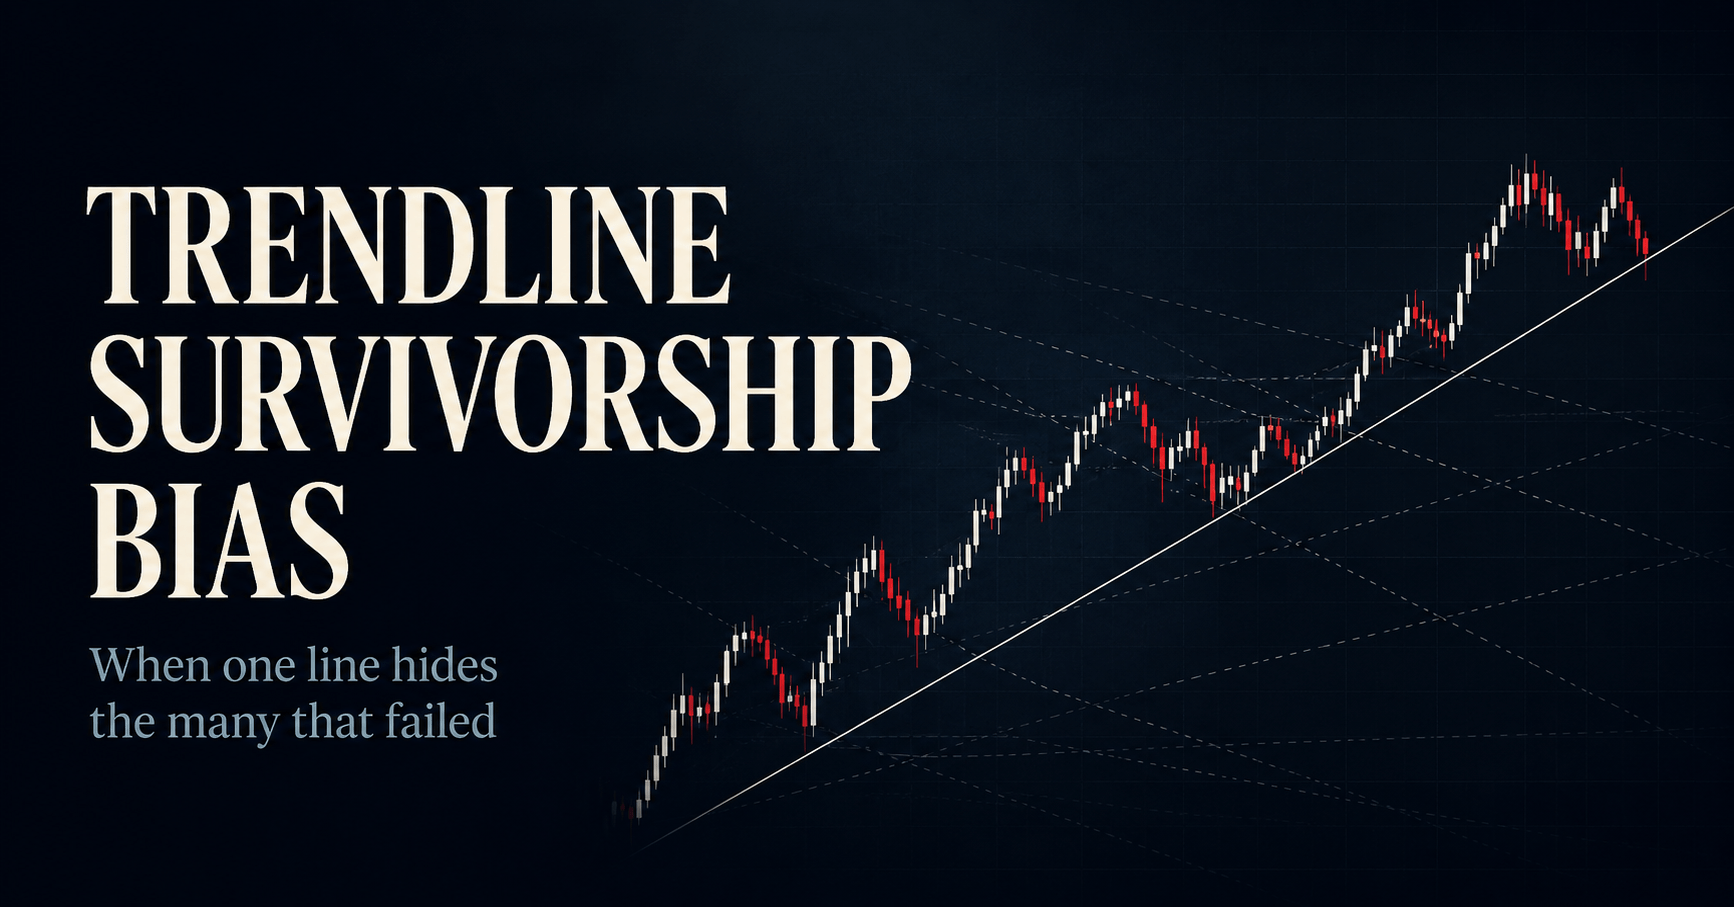
May 6, 2026
Trendline Survivorship Bias: Why a Line That Worked Can Mislead You
Retail trendline trading looks free but compounds 1% drag into a $598,099 wealth gap on $200K over 35 years. The chart never shows what it deleted.
Read the analysis →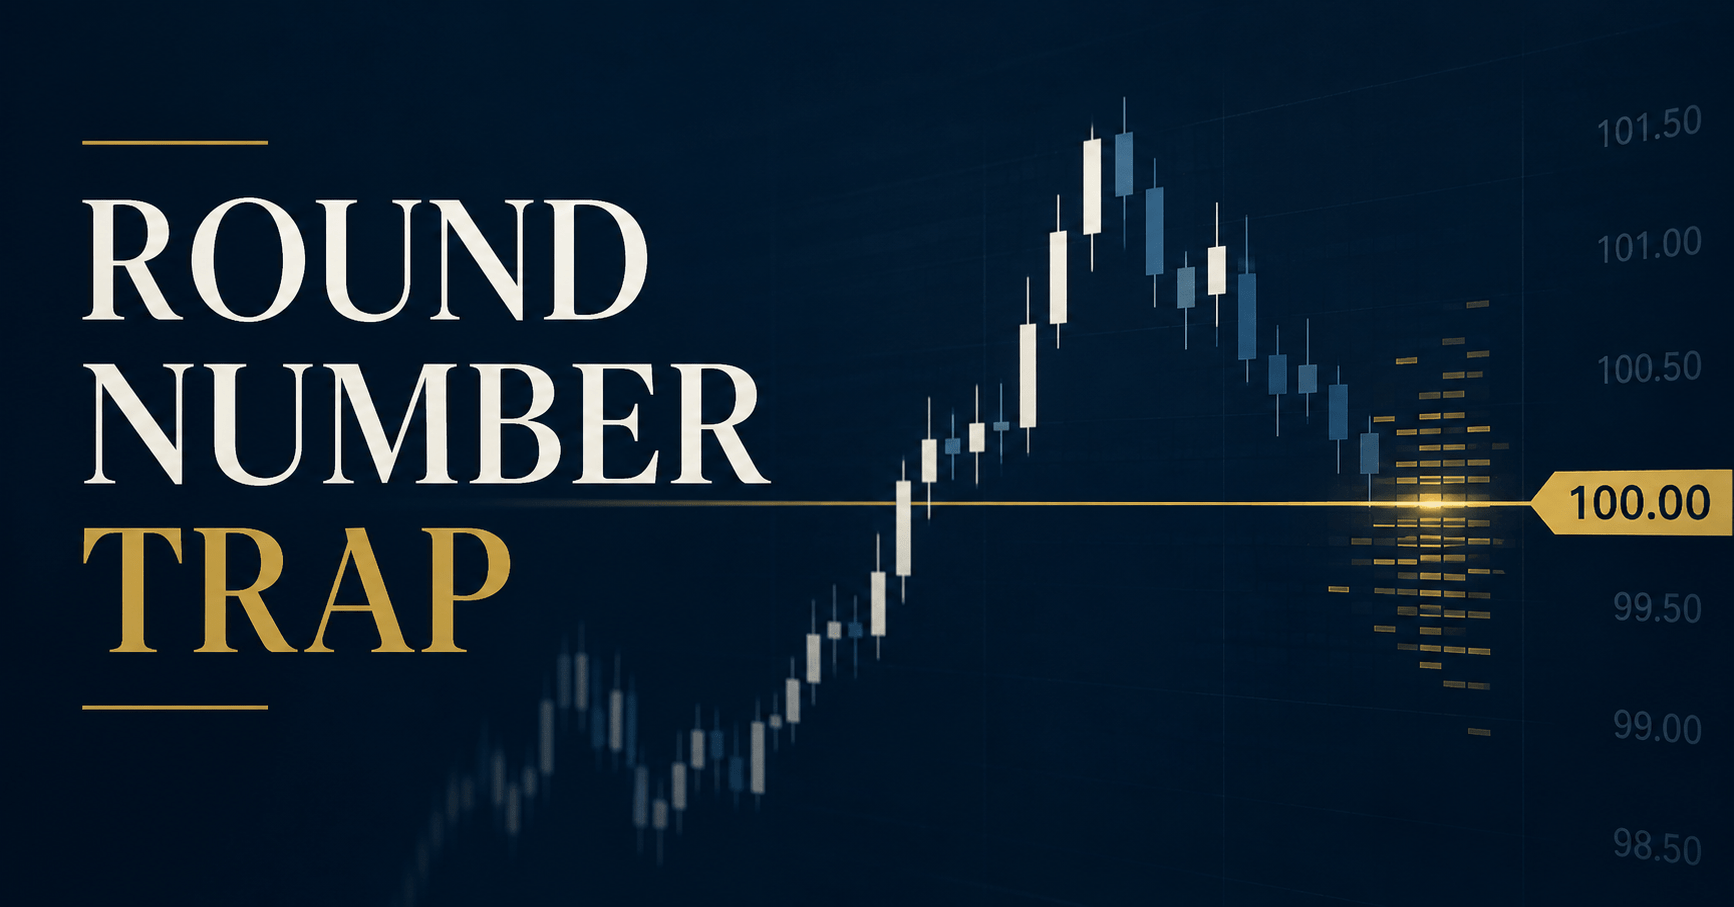
May 4, 2026
Support and Resistance at Round Numbers: What the Data Actually Shows
Round prices attract measurable trading attention, but the evidence does not show that they reliably hold or reverse. This guide separates clustering from prediction and gives a practical order-decision framework.
Read the analysis →