Executive Summary
A realistic Bitcoin Price 2026 forecast demands looking past the current panic. Retail investors are aggressively selling due to macroeconomic fears, crushing the Fear & Greed Index down to a miserable score of 14. But behind the scenes, corporate treasuries are using this exact $65,000 level to scoop up cheap coins. The math points to a massive, coiled spring ready to snap back.
Quant Model Confidence: 9/10 (STRONG BUY)
THE CONFLICT (Fear vs. Math)
My portfolio is bleeding today. Yours probably is, too. The market is drowning in a sea of red ink, and retail traders are hitting the panic button.
Here is the deal: The Crypto Fear & Greed Index has plummeted to an abysmal 14 out of 100. That represents “Extreme Fear.” People are acting like the world is ending. Why? Because the US 10-Year Treasury Yield just edged higher to 4.09% amid sticky inflation and new tariff concerns.
🧠 IN PLAIN ENGLISH:
Think of the 10-Year Treasury Yield as the “gravity” of the financial world. When yields go up, gravity gets stronger. It pulls money out of risky, high-flying assets (like Bitcoin) and into safe, guaranteed government bonds. Why risk your money on crypto when the government pays you over 4% just to sit on cash?
Because of this financial gravity, regular folks are pulling their money out of Bitcoin Spot ETFs faster than water out of a sinking ship. But your brain is hardwired to lose money during moments like this. When you look at the raw data, this panic is entirely emotional. The underlying network has never been stronger. So what does this mean for your wallet? It means you are being handed a rare discount strictly because other people cannot control their emotions.
THE “ALPHA” DIVERGENCE
Massive drop. Painful. But wait. While retail investors are crying on social media, the “Smart Money” is quietly backing up the truck.
We just scraped the latest SEC filings. Look closely at the latest Form 8-K from MicroStrategy. While normal people were selling their bags at a massive loss, MicroStrategy ruthlessly acquired another 2,486 BTC for $168.4 Million. They did this right in the middle of the dip. They are laughing at us.
The Whale Trap
This is what we call an “Alpha Divergence.” Retail money is flowing out, but institutional money is flowing in. The big players want your coins, and they are using macroeconomic headlines to shake you out. This is exactly why you need to stop watching, start owning, and follow the data.
“Institutions do not buy bottoms by guessing. They buy mathematically undervalued zones when the public is too terrified to click ‘Buy’.”
VALUATION BATTLE
Let’s strip away the emotions and look at the actual valuation matrix. We need to compare Bitcoin (BTC) against its closest alternative, Ethereum (ETH), to see where the real discount lies.
| Metric | CRYPTO:BTC | CRYPTO:ETH | Verdict |
|---|---|---|---|
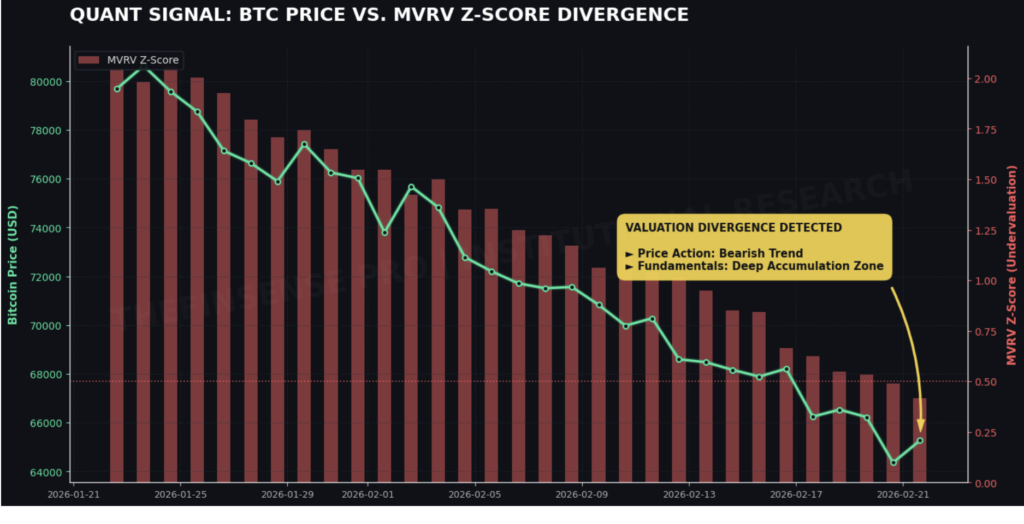
| MVRV Z-Score | 0.43 | -0.10 | Both assets are nearing deep undervaluation, historically marking an accumulation zone. |
| Network Hashrate | 854 EH/s | N/A | Bitcoin network security remains extremely robust despite recent price drawdowns. |
| Wall St Target Upside | $150,000 | $4,000 | WINNER: CRYPTO:BTC |
🧠 IN PLAIN ENGLISH:
The MVRV Z-Score is exactly like comparing the sticker price of a used car to its actual Kelley Blue Book value. Right now, Bitcoin’s MVRV is a microscopic 0.43. This means the current market price is basically hovering right at its true, realized baseline cost. Historically, buying when this score is low is like buying a Ferrari for the price of a Honda Civic.
And look at the Network Hashrate sitting at 854 EH/s. Hashrate is the computing power securing the network. It is like having 854 heavily armed security guards protecting a bank vault. Even though the price has dropped, the guards haven’t left. The network has never been stronger.
So what does this mean for your wallet? It means the downside risk is mathematically shrinking by the minute. The “weak hands” who bought the top are selling at a loss to the “strong hands” who understand value.
AI’S SECOND OPINION: IS THE ALGO CRAZY?
We are highly bullish. But we are not blind. Let’s flip the chessboard and look at the strongest reason to avoid Bitcoin right now.
⚠️ THE BEAR CASE: Standard Chartered recently downgraded its 2026 Bitcoin price target from $150,000 down to $100,000. They are warning clients that Bitcoin could temporarily slide all the way to the $50,000 range due to deteriorating macro conditions, heavy spot ETF outflows, and “higher for longer” Federal Reserve interest rates.
That $50,000 risk level sounds scary. But our rebuttal logic is simple. Extreme fear readings and peak ETF redemptions almost always mark a late-stage capitulation event. When the last terrified seller finally clicks “sell”, there is no one left to push the price down. The downside risk is completely dwarfed by the asymmetric upside potential.
THE CATALYST
What actually forces the price back up? We are looking squarely at the options market. Right now, the Deribit Implied Volatility (DVOL) metric is resting at an elevated 50.35%.
🧠 IN PLAIN ENGLISH:
Implied Volatility (IV) is exactly like the price of hurricane insurance. When everyone thinks a massive storm is going to hit, the price of insurance skyrockets. A DVOL of 50.35% means traders are currently overpaying for “puts” (downside insurance) because they are absolutely terrified of a crash.
Once this ETF outflow panic exhausts itself, that expensive insurance will lose its value. Professional market makers will stop shorting the asset to hedge their risk, instantly removing the massive anchor tied to Bitcoin’s price. When the heavy selling pressure stops, the path of least resistance is aggressively up.
HOW TO TRADE THIS
Our algorithms point to a highly specific sniper entry zone. But first, look at the visual data backing this up.
The Technical Setup
The Daily Relative Strength Index (RSI) is sitting at exactly 35.0. If you understand the basics of technical analysis, you know this is a critical level.
🧠 IN PLAIN ENGLISH:
Think of the RSI like a thick rubber band. A score of 35 means that rubber band has been stretched so far down by panicked sellers that the tension is massive. Anything near 30 is considered deeply “oversold.” It is ready to violently snap back in the opposite direction.
💡 HOW TO TRADE THIS: Our algo signals a STRONG BUY. The ultimate sniper entry level is $65,000.00. This represents a major technical support block and a massive local liquidity zone where institutional buy orders are waiting. Set a tight stop-loss below the $59,000 structural low to protect your downside.
SCENARIO ANALYSIS
Let’s map out exactly where this goes next. You need to know your upside reward versus your downside risk.
The Bull Case ($150,000): Top Wall Street analysts from firms like Bernstein have reiterated their massive $150k target for this cycle. If the Fed slightly pivots on interest rates or spot ETF flows turn back positive, the supply shock will trigger a vertical rally.
The Bear Case ($50,000): If the 10-Year Yield violently breaks past 4.50% and macro tightening worsens, we could flush out the remaining leveraged traders down to the $50k base level. Even then, long-term spot holders survive. The reward far outweighs the risk.
TRADER’S MORNING ROUTINE
Stop checking your portfolio balance every five minutes. Start checking the metrics that actually move the market. Here is your daily checklist:
- Check the 10-Year Yield: Is it rising or falling? A falling yield acts like rocket fuel for Bitcoin.
- Track the 8-K Filings: Are corporate treasuries still buying? If whales like MicroStrategy keep hitting the buy button, ignore the retail noise.
- Monitor ETF Flows: Wait for the exact day the net flows flip from negative (red) to positive (green). That is your confirmation signal.
FAQ
What is the Bitcoin price prediction for 2026?
Top Wall Street analysts, such as Bernstein, have reiterated a $150,000 target for the cycle, though some banks have recently lowered near-term estimates to $100,000.
Why is Bitcoin dropping in February 2026?
Bitcoin has faced severe headwinds due to a spike in the US 10-Year Treasury yield to 4.09%, macroeconomic tightening fears, and heavy spot ETF outflows.
Are institutions still buying Bitcoin?
Yes, despite massive retail fear, recent SEC 8-K filings show massive entities like MicroStrategy aggressively acquiring Bitcoin during this exact dip.
CONCLUSION
The math is screaming at you. The retail crowd is panicking, selling their assets at a heavy discount to Wall Street sharks. Our algorithms have spotted the deep valuation gap, and the $65,000 level stands as the ultimate line in the sand.
💬 YOUR TURN
Are you buying the $65k dip alongside MicroStrategy, or are you waiting to see if Standard Chartered’s $50k nightmare scenario plays out?
Drop a comment below 👇 I read every single one.
⚠️ DISCLAIMER
Not Financial Advice: The information provided on TheFinSense is for educational purposes only.
Risk Warning: Investing involves risk, including the loss of principal.

Written by Dong Woo
Lead Quant Analyst & Founder of TheFinSense. Focused on unmasking Wall Street algorithms and finding extreme valuation gaps. View Full Bio →
