
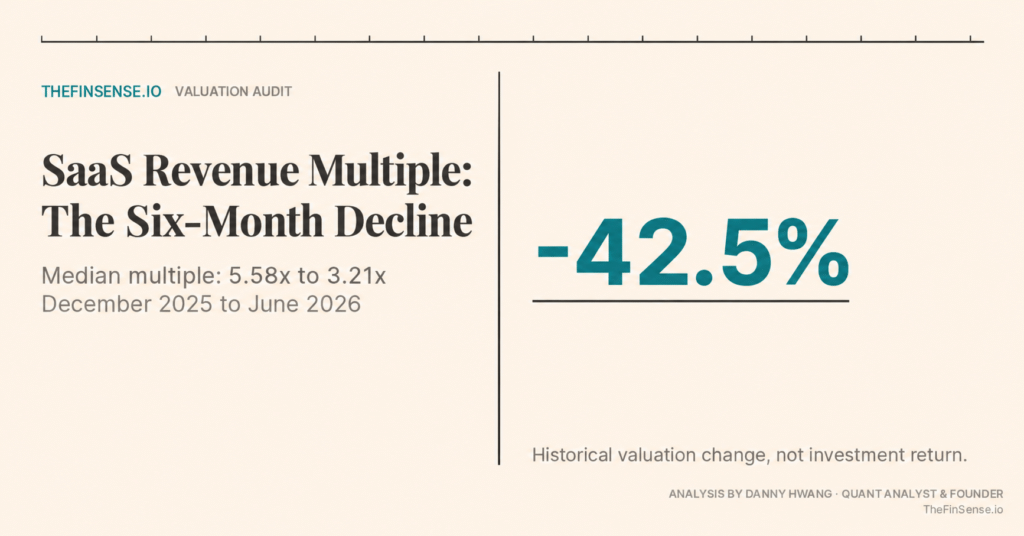
Between December 2025 and June 2026 the median public SaaS revenue multiple fell from 5.58x to 3.21x. That is a drop of 42.5% in six months, and it left the measure at its lowest level since September 2011.
The six-month framing hides what actually happened. January and February did 83% of the damage. The remaining four months, March through June, accounted for the other 17%, including a slight recovery in March.
Reading the file month by month rather than endpoint to endpoint turns up something stranger still. Over the same six months in which the median multiple fell 42.5%, the median reported revenue-growth rate across constituents rose, and the median Rule of 40 score increased by nearly 30%.
On this page
The 2026 Drop Was Two Months, Not Six
The six-month endpoints can suggest a gradual decline. The index file instead locates most of this move in January and February 2026. Read the monthly observations before explaining the entire period as one continuous trend.
| Month end | Median ARR multiple | Change from prior month |
|---|---|---|
| Dec 2025 | 5.58x | n/a |
| Jan 2026 | 4.81x | -13.8% |
| Feb 2026 | 3.62x | -24.8% |
| Mar 2026 | 3.68x | +1.8% |
| Apr 2026 | 3.58x | -2.8% |
| May 2026 | 3.41x | -4.7% |
| Jun 2026 | 3.21x | -5.8% |
February alone took 24.8%. January and February together took the median from 5.58x to 3.62x, a decline of 35.2% and 83% of the whole six-month drop. Then the measure stopped falling quickly. March rose 1.8%. From the end of February through June, including that rebound, the median declined another 11.1%; measured from the end of March, the April-to-June decline was 12.7%.
Median ARR multiple
| Month end | Median ARR multiple |
|---|---|
| Dec 2025 | 5.58x |
| Jan 2026 | 4.81x |
| Feb 2026 | 3.62x |
| Mar 2026 | 3.68x |
| Apr 2026 | 3.58x |
| May 2026 | 3.41x |
| Jun 2026 | 3.21x |
📚 Source: SaaS Capital Index, median ARR multiple, monthly readings, downloadable data file dated 30 June 2026 · saas-capital.com
SaaS Capital dates the trigger the same way. Writing in April 2026, the firm said the multiple had been range-bound from late 2022 through late 2025, and that at the beginning of 2026 growing concern that AI posed an existential risk to the SaaS business model catalysed a sharp re-rating lower.
Range-bound is the word that matters, because those three years get described as a slow bleed and the file does not support it. From the November 2022 low of 6.25x the median rose to 7.43x in July 2023 and 7.30x in November 2024 before easing to 5.58x by December 2025. The whole stretch sat between 5.58x and 7.43x, and the net change across it was a fall of about a tenth.
This is the same pricing question that runs through the valuation cluster. Adjusted P/E, the PEG ratio and economic moat each separate what a business is priced at from what it actually is.
This analysis describes the sector median. Do not map its dollar examples onto an individual company, a top-quartile name, or a diversified software ETF without checking that name’s own numbers first.
What the SaaS Revenue Multiple Actually Measures
How is the SaaS Capital Index built?
The SaaS Capital Index divides each company’s market capitalisation by its annualised current run-rate revenue, then reports the median across the constituents. In June 2026 there were 63 of them. The index does not adjust for cash or debt, so it prices the equity alone, which makes it closer to a price-to-sales ratio than to a textbook enterprise-value multiple.
The denominator deserves a sentence of its own, because the index calls itself an ARR multiple and the name is looser than the arithmetic. SaaS Capital takes all reported GAAP revenue, divides the most recent quarter by three to get a monthly figure, and multiplies that by twelve. It is annualised run-rate revenue, not the contracted recurring revenue a company reports to its own investors.
Two mechanics follow. The market-cap side refreshes monthly while the revenue estimate moves quarterly, so a reading can travel a long way between two prints of the same revenue. And when a higher quarter does land, the multiple falls even if the share price has not moved.
📚 Source: SaaS Capital Index methodology, 63 constituents as of June 2026, market capitalisation divided by annualised current run-rate revenue, no cash or debt adjustment · saas-capital.com
Published SaaS multiples disagree for the same reason. In March 2026 this index read 3.68x while Aventis Advisors reported 3.4x. Part of that gap is definitional, because enterprise value adds debt and subtracts cash while the SaaS Capital Index uses equity market capitalisation with neither adjustment. The two also screen different company lists. Construction choices move headline numbers the same way they make a Dow figure and a Nasdaq figure disagree about the same year.
📚 Source: Aventis Advisors, median SaaS EV/Revenue 3.4x, March 2026 · aventis-advisors.com
What sets a SaaS revenue multiple?
Growth, margin and risk do, at the company level. Damodaran’s July 2000 cross-section of 273 US technology firms found that fundamentals explained 53.8% of the variation in price-to-sales ratios, with net margin the strongest single term. That market predates SaaS, and for the internet subset of the same period his regression became too noisy to trust, so read it as a mechanism rather than a forecast. Net revenue retention belongs in the same conversation but sits outside that regression, and outside the index too.
There is also a ceiling on what any single multiple can carry. Mauboussin and Callahan showed in 2024 that headline multiples reflect economic reality less well as companies shift spending into intangibles like software. Treating Microsoft’s intangible investment as capital would have raised its reported fiscal 2023 EBITDA by 43.6% and its net income by 14.7%.
📚 Source: Damodaran, “Revenue Multiples,” NYU Stern, market regressions section, 273 observations, R-squared 53.8% · stern.nyu.edu · Mauboussin & Callahan, “Valuation Multiples,” Morgan Stanley Investment Management, April 2024 · morganstanley.com
What the Operating Medians Can Tell You
The same file that records the price also records two operating measures for the index. The workbook contains company-level revenue-growth and Rule of 40 observations; the operating medians below are calculated by TheFinSense. Putting the three series next to each other changes the picture.
Rule of 40 adds revenue growth to a profit margin. In this workbook it is growth plus the GAAP net-income margin, rather than an EBITDA or free-cash-flow margin. State the margin definition before comparing these scores with another company’s Rule of 40.
What else the June 2026 index file shows
- Across the six months in which the median multiple fell 42.5%, the median reported revenue-growth rate across constituents rose from 12.62% to 14.19%, while the median Rule of 40 score rose from 15.79% to 20.45%. SaaS Capital Index file, 30 June 2026, Growth Rate and Rule of 40 sheets
- The distribution shifted unevenly. From December to June the published 25th-percentile cutoff fell 29.7% and the 90th-percentile cutoff fell 23.3%, against 42.5% for the median. Monthly Valuation Multiple sheet, published percentiles
- The May 2026 rebound was concentrated toward the upper end of the distribution. The published 90th-percentile cutoff rose 26.4% that month while the median fell 4.7%. Monthly Valuation Multiple sheet, April and May readings
| Measure | Dec 2025 | Jun 2026 | Change |
|---|---|---|---|
| Median ARR multiple | 5.58x | 3.21x | -42.5% |
| Median revenue growth rate | 12.62% | 14.19% | +1.57pp |
| Median Rule of 40 score | 15.79% | 20.45% | +4.67pp |
Multiple compression means investors pay less for each dollar of annualised run-rate revenue. Over these six months, the median reported revenue-growth rate and the median Rule of 40 score both improved.
The price attached to a dollar of SaaS revenue fell 42.5% while these two reported operating medians improved. The repricing may still have reflected expectations about future growth, pricing power or AI-driven competition; the file does not settle whether those expectations were justified.
The sector median cannot tell you whether one company’s revenue is shrinking. Read its income statement and reconcile its revenue, market value and reporting dates before explaining a change in its multiple.
The dispersion adds a second warning. The published median cutoff fell more than the 25th- and 90th-percentile cutoffs, so the distribution shifted unevenly. These are monthly percentile cutoffs, not returns for fixed groups of weak or strong companies.
Method at a glance: hold the revenue base constant and multiply $100,000 by each dated median divided by the August 2021 median. The full method and exact source vintage below explain precision, percentiles and missing operating observations.
A $100,000 Valuation Bridge, Anchored at the 2021 Peak
Percentages are hard to hold in the head, so it helps to fix a revenue base and watch what the changing multiple does to the value put on it.
Picture a basket of pure-play SaaS names valued at $100,000 at the August 2021 median of 16.93x. Call it Elena’s basket. Hold the revenue underneath it flat and never trade it, and the only thing that moves is the price the market attaches to each dollar of that revenue.
Elena’s basket is a modelling device, not an account and not a person. It isolates the effect of the multiple by holding revenue constant, which no real portfolio does.
| Reading | Median ARR multiple | Indicated value | Change from the 2021 peak |
|---|---|---|---|
| Peak, Aug 2021 | 16.93x | $100,000 | $0 |
| Reset low, Nov 2022 | 6.25x | $36,895 | -$63,105 |
| Band, Nov 2022 to Dec 2025 | 5.58x to 7.43x | $32,994 to $43,886 | n/a |
| Pre re-rating, Dec 2025 | 5.58x | $32,994 | -$67,006 |
| After the cliff, Feb 2026 | 3.62x | $21,365 | -$78,635 |
| Latest reading, Jun 2026 | 3.21x | $18,986 | -$81,014 |
Split the $81,014 by period and the slow-bleed story comes apart on arithmetic alone. The 2022 rate reset took $63,105 of it, or 78%. The three range-bound years that followed gave back $3,901 net, and did so unevenly, rising twice before falling. The 2026 re-rating took $14,008, which is 17.3% of the total.
Inside that $14,008, January and February account for $11,628. The four months from February to June account for $2,379.
The 2026 leg cut 42.5% off what was left, but it was only 17.3% of the total damage since 2021. Those are two different denominators. Mixing them is how a two-month event gets remembered as a five-year collapse.
One reconciliation before these dollars get quoted anywhere else. The bridge tracks a pure-play median that fell about 81% from the peak; a fund’s own decline over the same dates can be very different, because its holdings, weights and dates differ. If you hold the wrapper rather than the basket, what an ETF is matters more here than the median does, and the same gap shows up across ETFs and mutual funds tracking one index.
Sensitivity: what changes the 2026 figure
Four scenarios
Every value below stays anchored to $100,000 at the August 2021 peak of 16.9266x. None of these is a return on money invested at the first multiple shown.
| Scenario | Multiple | Indicated value | Difference from Dec 2025 |
|---|---|---|---|
| Base: June 2026 median | 3.21x | $18,986 | -$14,008 |
| Bottom quartile, June 2026 | 2.42x | $14,320 | -$18,674 |
| Top quartile, June 2026 | 6.33x | $37,405 | +$4,412 |
| Partial recovery to 4.8x | 4.80x | $28,358 | -$4,636 |
At the same June 2026 date, the derived 75th-percentile cutoff stood above the December 2025 median, while the bottom-quartile cutoff sat at 2.42x. The cross-sectional spread on one date was wider than the median’s six-month move.
📚 Source: SaaS Capital Index, published median, 25th- and 90th-percentile readings, plus TheFinSense’s inclusive 75th-percentile calculation from the 63 June constituent multiples, all from the file dated 30 June 2026 · saas-capital.com
Is a 3.21x SaaS Multiple Cheap or a Warning?
Should you sell after a SaaS multiple drop?
The multiple alone cannot answer that. The January and February readings show when the sector median fell. They do not isolate price changes from revenue updates or establish why investors repriced individual companies.
Whether a decline is realised or unrealised matters less than it feels like it should. The question is whether the expected return from today’s price beats your alternatives, after taxes and switching costs. If the business itself has broken, that case stands on its own and has nothing to do with the sector median.
Is 3.21x cheap?
It depends entirely on the name. Damodaran’s determinants point to growth, margin and risk, so a decelerating company at 3.21x may be fairly priced while a faster, more profitable one at the same 3.21x is not. The June 2026 distribution makes the point on its own. The bottom quartile sat at 2.42x and the top quartile at 6.33x, a spread of well over two to one inside the same 63 companies.
If you run a SaaS business, treat the June 2026 median as public-market context. The 6.33x top-quartile cutoff describes a cross-sectional valuation boundary, not evidence that a particular high-retention company deserves that price or that a private firm could sell at it.
When a low multiple is the correct price
For some names it is. A company whose net revenue retention has fallen below 100% is losing more from existing customers than it wins back, and revenue that shrinks without new sales stops being recurring in any useful sense. For that business, 3.21x may be the market pricing a real problem. Damodaran’s cross-section is the reason to take the possibility seriously: fundamentals explained 53.8% of price-to-sales variation across the firms he measured, which supports taking fundamentals seriously, although nearly half of the variation was left unexplained.
The pattern does not look like a smooth repricing of a gradual decline. It looks like expectations changed abruptly in January and February. The shape shows when the market changed its mind. It does not show whether the change was justified.
Three checks separate the two cases faster than any sector figure will, and none of them uses the median as an input.
Last four reported quarters, not the share price
NRR and GRR are not GAAP measures and are not comparable between companies, so read the trend within one filer
The Rule of 40, run on the company’s own filings, with the margin definition stated
Three good answers do not prove a stock is cheap, and one bad answer does not prove a business is broken. What these checks tell you is whether the sector median is a useful starting point for this name or a poor substitute for company-level work.
Two more are worth running before you conclude anything. Look at free cash flow alongside stock-based compensation and the change in share count, because growth funded by dilution reads differently from growth funded by cash. Then compare the multiple against the company’s own history and against peers on similar growth and margin, rather than against the sector midpoint.
Why the fund you own moved differently
A fund’s return and a sector valuation multiple answer different questions. Compare both on identical dates and distinguish market-price returns from NAV returns before drawing a performance conclusion. The June index workbook supplies valuation ratios, not IGV or WCLD investment returns.
A fund return also depends on holdings, weights, distributions and portfolio changes. A median is one cross-sectional statistic. Its movement cannot explain the return of a fund with different constituents.
| Fund | 2022 | 2026 year to date | What it owns |
|---|---|---|---|
| IGV | -35.65% (market price) | Not shown | Large-cap North American software |
| WCLD | -51.71% (NAV) | -8.0% (8 Jun 2026) | Equal-weighted cloud software, BVP Nasdaq Emerging Cloud Index |
Sources: IGV 2022 market-price return: iShares calendar-year performance. WCLD 2022 NAV total return: WisdomTree SEC-filed annual-return data. The separately dated WCLD 2026 figure is quoted from Zacks, June 8, 2026, which reported -8.03% year to date. An IGV 2026 YTD return is not used here. The measures and dates differ, so this table cannot rank the funds against the index.
Re-underwrite each holding on its own growth, retention and margin, and a 3.21x median stops being a verdict.
The Bottom Line
The June 2026 sector median records the price attached to annualised run-rate revenue at that date. It is not an October market quote or a fair-value estimate for your holding. Across the first half of 2026, the multiple fell while two separate operating medians calculated from the workbook rose; neither comparison establishes why investors repriced individual firms.
Damodaran measured what sets a fair multiple. He did not measure how fast the answer can change, and it changes faster than the businesses it describes. A number that held a band for three years gave up 35% in two months while growth and Rule of 40 scores went the other way.
Open your SaaS holdings and check the last four quarters of revenue growth, retention and margin before treating 3.21x as either a bargain or a warning.
The multiple is a starting point, not a verdict.
Common Questions About SaaS Revenue Multiples
How long did the 2026 SaaS re-rating actually take?
Two months did most of it. The SaaS Capital Index median went from 5.58x at the end of December 2025 to 3.62x at the end of February 2026, a fall of 35.2%. That is 83% of the whole December-to-June decline of 42.5%. March rose 1.8%. From the end of February through June, including that rebound, the median declined another 11.1%. Calling it a six-month re-rating is accurate about the window and misleading about the event, because it spreads a January and February shock across four months in which the measure was mostly drifting.
Is a SaaS revenue multiple the same as P/S?
The version used here is closer to price-to-sales than its name suggests. A textbook EV/Revenue multiple divides enterprise value, which adds debt and subtracts cash, by revenue. The SaaS Capital Index instead divides market capitalisation by annualised run-rate revenue with no cash or debt adjustment, so it prices the equity alone, exactly as price-to-sales does. Aventis Advisors publishes a true enterprise-value series, which is part of why its readings sit slightly below the index. The Damodaran figure cited in this article comes from his price-to-sales regression, the closer cousin of the two.
Did SaaS companies get worse while the multiple fell?
The two operating medians do not establish that individual businesses improved or deteriorated. Between December 2025 and June 2026 the median reported revenue-growth rate across constituents rose from 12.62% to 14.19%, while the median Rule of 40 score rose from 15.79% to 20.45% and the median multiple fell 42.5%. These medians do not necessarily describe the same company or a fixed matched cohort. They do show that the repricing did not coincide with deterioration in those two calculated medians.
Can SaaS multiples fall below 3.2x?
They can, because 3.21x is a midpoint rather than a floor. Roughly half the 63 tracked companies traded below it in June 2026, and the published 25th percentile sat at 2.42x. Applied to the constant-revenue bridge in this article, a 2.42x mark is worth $14,320 instead of $18,986. The index has also been lower before. The last month it closed at or below the June 2026 level was September 2011.
How does the Rule of 40 set a fair multiple?
It does not set a fair multiple on its own. It is one check on growth and profitability, alongside valuation, risk and cash-flow analysis. The test adds a software company’s revenue growth rate to its profit margin and asks whether the sum clears forty. A company growing thirty percent at a twelve percent margin clears it comfortably. A company growing eight percent at a negative fifteen percent margin does not. Because the answer depends on which margin definition is used, state that definition before comparing two companies, and run the test on each holding before running it on the sector.
Financial disclosure
This article contains no affiliate links.
Disclaimer
This article is educational analysis and not investment advice. The $100,000 figure is a constant-revenue valuation bridge that illustrates how a changing multiple reprices a fixed amount of revenue. It is not a record of any real account, ETF or stock basket. Index readings are historical and do not predict future multiples, and individual holdings behave very differently from a sector median. Consider speaking with a licensed financial professional who knows your full situation before acting on anything here.
Update history
- : Removed the holdings and commercial-relationship statements from the financial disclosure because they could not be verified; the disclosure now states only that the article contains no affiliate links. Changed “nearly a third” to “nearly 30%” for the rise in the median Rule of 40 score (+29.5% in relative terms). No figures, sources or analysis changed.
- : Replaced the secondary-source WCLD 2022 return of -51.64% with the SEC-filed NAV total return of -51.71%, and labeled the IGV and WCLD return bases. Kept this table at a readable minimum width inside its keyboard-focusable horizontal scroll region on narrow screens. This is a source and measurement-basis change, not a finding that the earlier market-price figure was wrong. The separately dated June 8, 2026 WCLD quote remains attributed to Zacks; it is not a matched-period comparison.
- : Recomputed the bridge and percentile figures from the June 30 workbook (SHA-256 e06dbaa0…). Corrected the top of the 2022–2025 band from $43,887 to $43,886 ($100,000 × 7.428471 ÷ 16.926640 = $43,886.27, using the unrounded workbook values). Every other displayed figure matched. Also replaced an unsupported statement that held funds fell less than the median, and noted the share of price-to-sales variation the Damodaran regression left unexplained.
- : Recomputed the June workbook, corrected the derived 75th percentile and Rule of 40 change, identified the net-income-margin convention, and narrowed company-level and fund-return inferences. Withheld the unrecovered IGV June YTD claim. Updated the featured image to the historical window and 42.5% precision, and contained wide tables within keyboard-focusable scroll regions.
- July 24, 2026: Substantive correction. Replaced the incorrect 7.0x reading for late 2022 with the actual November 2022 low of 6.25x and restated the 2023 to 2025 period as range-bound between 5.58x and 7.43x rather than a steady drift. Restated the December 2025 to June 2026 decline as 42.5% rather than 43% and added the month-by-month path showing 83% of it fell in January and February. Recalculated every dollar figure from unrounded index values, changing the 2026 figure from $14,201 to $14,008 and the total from $81,065 to $81,014. Corrected a Morgan Stanley attribution: capitalising intangible investment raised Microsoft’s fiscal 2023 EBITDA by 43.6% and net income by 14.7%, not earnings by more than two fifths. Added median growth rate and Rule of 40 series. Replaced the bottom-quartile estimate of 2.5x with the published 2.42x. Replaced stale fund figures: IGV year to date is now -14.3% through 30 June 2026 and WCLD -8.0% through 8 June 2026, in place of readings taken at the April sell-off low. Removed a linear counterfactual chart and a rent comparison that added no analytical value, collapsed the methodology block, and moved internal links to canonical root paths. Clarified that the growth-rate, Rule of 40 and valuation figures are separate cross-sectional medians, recast percentile changes as moving cutoffs rather than fixed-company returns, and corrected the partial-recovery sensitivity sign.
- July 23, 2026: Original analysis published.
This article examines the June 30, 2026 data vintage. Later monthly files are separate observations and are not substituted into this historical comparison.