
In 1980, even the heaviest bar in the vault began to lose its weight.
Gold is an inflation hedge only in a narrow sense. Erb and Harvey (2013) found that gold’s real, inflation-adjusted price mean-reverts rather than tracking the cost of living. A buyer at gold’s January 1980 real peak lost roughly 83 percent of purchasing power before the metal recovered, a stretch reaching into 2001. Dirk Baur’s 2025 study of data from 1971 to 2025 found gold did not reliably beat inflation in any single month, quarter, or year.
Gold reacts strongly to large inflation shocks and, over long spans, outpaced rising prices. So gold can cushion a spike, yet it has not protected against ordinary inflation over typical horizons. In a taxable account, long-term gains on physical gold and physically backed gold funds may face the collectibles rate, up to 28 percent.
Is gold an inflation hedge? A 1980-peak buyer lost about 83 percent of real value over two decades. What the rest of the record shows is stranger than a simple crash.
Danny Hwang has spent the past year taking apart popular macro signals to see how they really work. It runs across TheFinSense’s macro-signal-literacy series. Most investors buy gold to hedge inflation. But Erb and Harvey (2013) showed its real price mean-reverts, so a buyer at gold’s 1980 peak watched most of that purchasing power erode before it recovered.
By this article’s gold/CPI method, gold looks expensive again in mid-2026. As of July 1, 2026, spot gold was about $3,979 an ounce, against a CPI-U index of 335.1 for May 2026 (the latest BLS reading). On this article’s ratio that screens well above the long-run average near 3.2, and above even the 8.73 reading of January 1980. The exact number shifts with the price date and inflation series you use, so read it as a valuation snapshot, not a forecast. This analysis covers U.S. dollar gold priced against U.S. CPI. Gold held inside an IRA is treated differently from the taxable-account collectibles rate discussed here, subject to the eligibility and distribution rules in IRC Section 408(m).
Is Gold Really an Inflation Hedge?
Gold’s case is real: it survived every currency that ever mocked it, and in the 1970s it soared while the dollar sank. Central banks keep buying it, dealers and headlines repeat the inflation story, and your neighbor’s gains make the belief feel obvious. The question is not whether gold has value, but whether it tracks the cost of living.
Gold can shield against sudden inflation shocks and currency collapse. But over the time frames people actually invest, it has not kept steady pace with ordinary, moderate inflation.
The honest version of the story lives in the gap between those two claims. Long-time index investors learned it the hard way. From its 1980 peak through 2001 gold was a terrible inflation hedge, its nominal price falling by about 65 percent. That stretch covered two full decades, the horizon most people actually hold an asset.
Maybe you already own gold for inflation, are about to buy it, or hold it as a crisis diversifier. Either way, the sections ahead trace exactly where the protection went.
| Condition | Does gold hedge? |
|---|---|
| Sudden, large inflation shock | Yes, reacts strongly |
| Ordinary, moderate inflation | No, mean-reverts instead |
| Century-plus horizon | Roughly, over very long spans |
| Typical 5 to 20 year horizon | Unreliable |
📚 Source: Erb & Harvey, 2013 · nber.org
Read this guide if: you own gold, or are weighing it, as protection against ordinary U.S. dollar inflation over a typical investing horizon.
Does not apply to: non-U.S.-currency gold buyers, century-long buy-and-hold horizons, and the tax math for gold held inside an IRA.
Does Gold Track Inflation Over Time?
The reputation rests on one decade, so the natural next question is what the other four decades actually show.
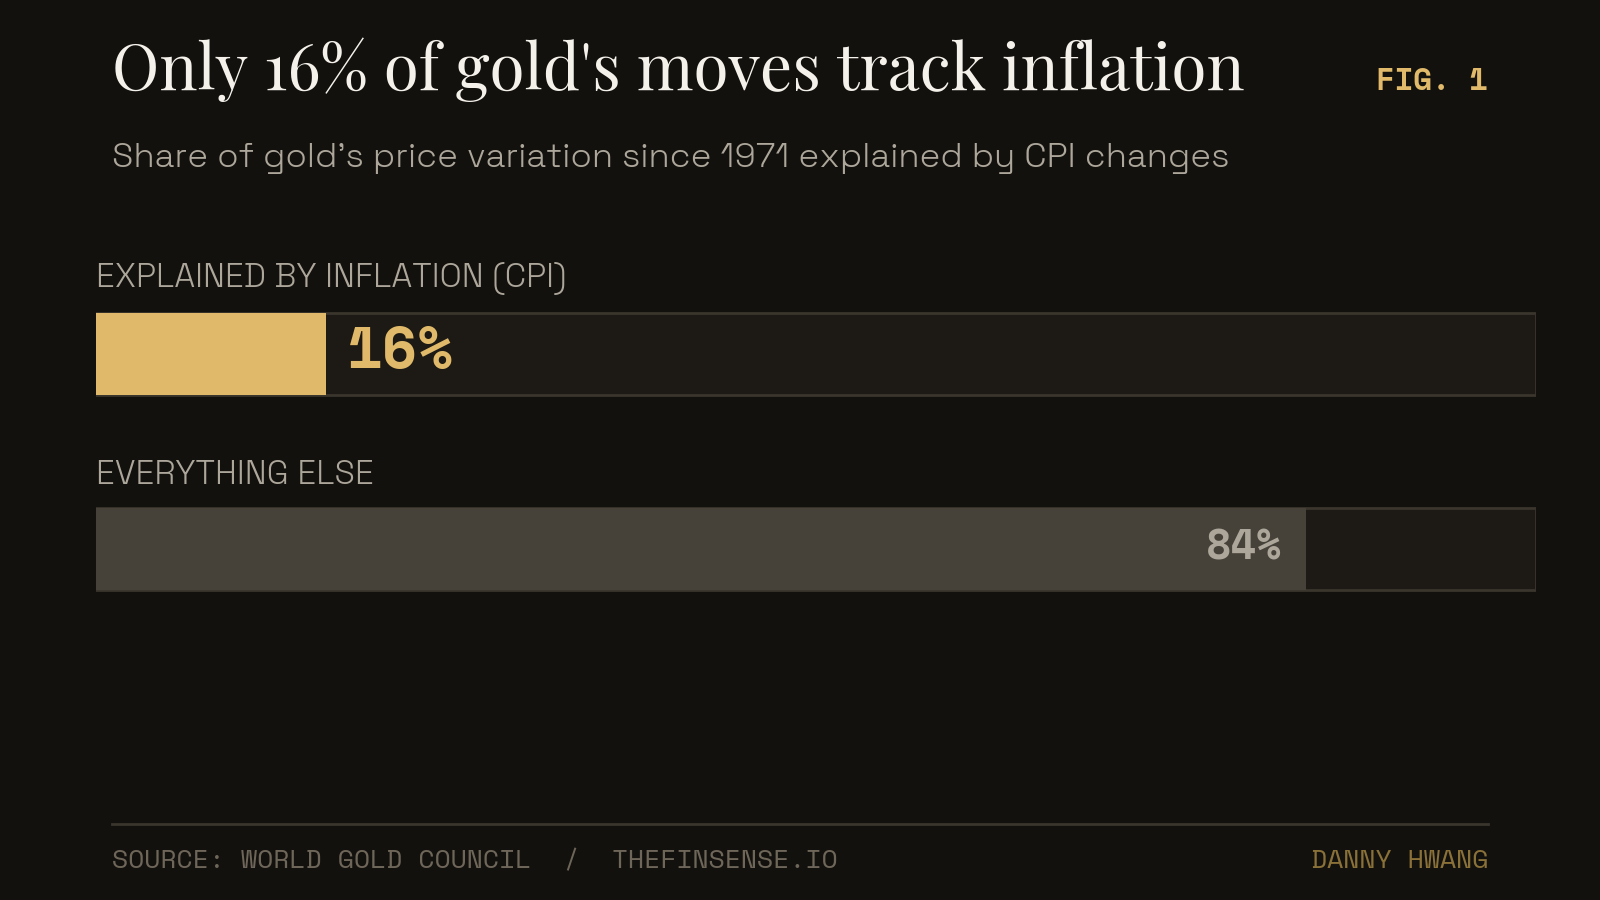
Gold’s fifty-year record shows no dependable link to inflation. Dirk Baur’s 2025 study of data from 1971 to 2025 found gold did not beat inflation in any reliable month, quarter, or year. The World Gold Council reports that, across 1971 to 2020, only about 16 percent of gold’s price movement is explained by changes in the consumer price index.
After its 1980 peak, gold fell roughly 65 percent in nominal terms over the next two decades. A long price chart can look protective, yet most of that strength traces to a single explosive year rather than steady inflation tracking.
Before turning to dollars, look at how little of gold’s movement inflation explains. The World Gold Council finds that, over 1971 to 2020, consumer-price-index changes explain about 16 percent of how gold has moved. Across the 1971 to 2025 sample, gold did not consistently beat inflation in any single month, quarter, or year.
📚 Source: World Gold Council, gold and CPI relationship · gold.org
The chart that looks like protection is mostly one year, 1980, doing the work.
Picture moving a meaningful slice of your savings into gold near that 1980 high. You would have spent the next twenty years watching its real value thin out while wages and everyday prices climbed past it. That is not a hedge doing its job. It is an asset waiting for one rare decade to repeat.
Over the same fifty years, broad stock baskets like the Dow, Nasdaq, and S&P 500 delivered stronger long-run real wealth creation than gold, though stocks are not direct CPI-linked hedges either. Investors reaching for gold against rising prices often overlook how stocks and real estate built real wealth across the very same decades.
Why Does Gold’s Real Price Mean-Revert?
Fifty years of weak tracking leaves one thing to explain: what gold’s price is actually doing underneath.
Gold’s real price, meaning its value after stripping out inflation, behaves like a valuation ratio rather than a steady store of worth. Erb and Harvey (2013) showed this real price drifts back toward a long-run average near 3.2 on their gold-to-inflation ratio. When the ratio sits far above that average, as it did at 8.73 in January 1980, the years that follow tend to deliver weak real returns.
The higher gold climbs in real terms, the harder it has historically snapped back. The starting price level drives what comes next.
Why does gold’s real price mean-revert?
Gold’s real price mean-reverts because it behaves like a valuation ratio rather than a fixed store of worth. Erb and Harvey (2013) measured a gold-to-inflation ratio that averages near 3.2 and pulls back whenever it stretches far above that level. Extreme readings rarely last.
What does a high gold-to-CPI ratio predict?
A high gold-to-CPI ratio predicts weak future real returns. When Erb and Harvey’s ratio reached 8.73 in January 1980, far above its 3.2 average, the next two decades delivered an 83 percent real decline. The starting price level, not inflation, set the outcome.
The mechanism is older than the data. Before Erb and Harvey (2013), many treated gold’s inflation hedge as a settled fact. Their decomposition showed realized inflation barely predicts gold returns, and Baur (2025) found the link mainly fires in shocks. Modern analysis now treats gold’s real price as the driver.
One major driver underneath is the real interest rate. Gold pays no coupon and no dividend, so its main competitor is the real yield on safe bonds. When inflation-adjusted rates rise, holding a zero-yield metal costs more in forgone interest, and gold tends to fall; when real rates drop or turn negative, that opportunity cost shrinks and gold tends to rise. The link was especially tight through the 2000s and 2010s: by one bank’s analysis, changes in the 10-year TIPS real yield tracked about 84 percent of gold’s variation from 2005 to 2021. It is the same lever behind how the Fed moves your portfolio across a cycle, and the gap between a popular signal and its real mechanism mirrors what the yield curve actually signals about coming recessions.
That relationship has loosened lately, and the article will not pretend otherwise. Since 2022, gold has climbed even as real yields stayed positive, and the TIPS-yield link fell to near zero, because record central-bank buying and de-dollarization began setting the price at the margin instead of the opportunity-cost math. Over multi-year cycles real rates remain gold’s primary structural driver; over the last few years, official-sector demand has overridden it.
📚 Source: RBC Wealth Management, gold and 10-year TIPS real-yield correlation · World Gold Council, central-bank demand
How fast does gold snap back from extremes?
Gold snaps back slowly rather than in one crash. From its January 1980 real peak the metal had already lost about 67 percent of real value within five years, then ground lower until March 2001. Erb and Harvey describe this as a roughly decade-long mean reversion.
The foundational evidence comes from Erb and Harvey (2013), whose real gold-to-inflation ratio is the spine of this whole picture. They treat that ratio the way an analyst treats a valuation multiple, expensive readings predicting thin returns ahead.
Researchers reach the same verdict. Dirk Baur, a finance professor who studies gold’s behavior, concludes the metal has not been a dependable inflation hedge outside rare shocks (Baur 2025).
📚 Source: Baur, 2025 · ssrn.com
The higher gold’s real price climbs, the worse its next decade tends to be.
Two decades of patient holding, undone by a single stretch of mean reversion.
Formula: real_value = 100000 × (end_ratio / entry_ratio)
Model: lump-sum repricing on the Erb-Harvey real gold/CPI ratio.
Assumptions: $100,000 at the 1980 real peak (ratio 8.73), held to the March 2001 trough (ratio 1.46), U.S. CPI numeraire.
Does not apply to: non-U.S. numeraire gold or century-plus horizons.
What the 83% means: the fall in gold’s real (gold/CPI) valuation ratio, 8.73 to 1.46. This is close to, but distinct from, the roughly 85 percent real purchasing-power loss on a 1980-peak lump sum reported by CBS/Swedroe.
Regulatory catalyst: not applicable for this market topic.
Ratio definition: gold/CPI ratio = annual-average London gold price ÷ CPI-U (1982–84 = 100). Month-end versus annual-average choices shift each ratio by a few percent.
Across both studies the through-line is the same: what a buyer pays relative to gold’s long-run average, not the inflation reading, decides the real outcome.
One honest caveat before the case study. The 1980 peak used below is chosen deliberately as the worst realistic entry point in the modern record, so it shows the downside at its most extreme. The broader claim of this article does not rest on that single date; it rests on the full Erb-Harvey series and their 22-country sample. Buy gold at almost any point after 1980, or dollar-cost average in over years, and the picture improves materially. The lesson is about entry valuation, not a promise that gold always disappoints.
Soren Bought Gold at the 1980 Peak. Here’s What Happened.
Soren’s $83,276 real loss traces back to a single 1980 peak.
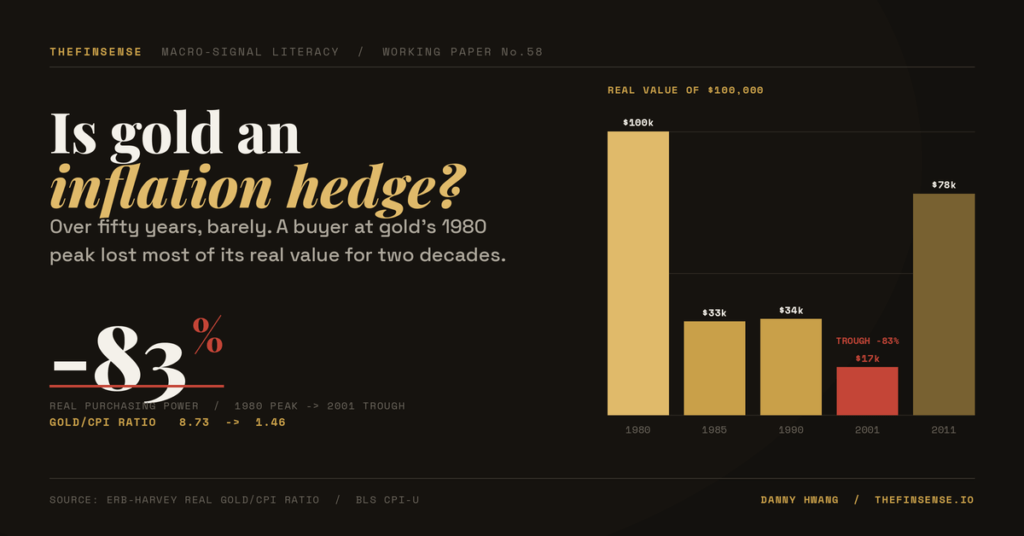
A buyer at gold’s January 1980 real peak faced one of the asset’s worst stretches. Using the Erb and Harvey real gold-to-inflation ratio, a $100,000 position at that peak was worth about $16,724 in real purchasing power by the March 2001 trough. That is a decline of roughly 83 percent, spread across two decades when inflation protection was the whole reason to hold the metal.
Five years in, the real loss had already reached about 67 percent. The damage came not from a crash but from a slow, grinding repricing toward gold’s long-run average.
That same gap between story and mechanism is exactly what cost Soren most of a $100,000 gold position over twenty years.
Soren is fifty, single, and earns about $120,000 a year. When inflation headlines turned relentless, they moved $100,000 into gold, treating the metal as the obvious shield for a nest egg they wanted intact at seventy. The position felt prudent. It looked like the responsible, contrarian move everyone online seemed to praise. Two decades later the gold was still there, untouched in the vault, and on paper it still weighed the same. What had changed was everything the money was supposed to buy. If your own inflation worry has ever pushed you toward gold, Soren’s twenty years are the experiment you would have been running.
Soren is a hypothetical composite drawn from common retail-investor patterns. Not a real individual.
| Parameter | Value |
|---|---|
| Age at purchase | 50 (target age 70) |
| Annual income | $120,000, single filer |
| Initial gold position | $100,000 lump sum |
| Monthly addition | $0 |
| Holding window | 20 years (1980 peak to 2001 trough) |
| Basis for outcome | Real gold-to-CPI repricing (Erb-Harvey) |
Most readers guess gold slipped maybe 20 to 30 percent after 1980 before bouncing back within a few years.
The record is harsher, and slower. The table below tracks the real value of Soren’s $100,000 at four exit points, using the gold-to-CPI ratio at each date.
| Exit year | Gold/CPI ratio | Real value of $100,000 | Real loss |
|---|---|---|---|
| 1980 (peak entry) | 8.73 | $100,000 | 0% |
| 1985 | 2.87 | $32,875 | −67.1% |
| 1990 | 2.95 | $33,792 | −66.2% |
| 2001 (trough) | 1.46 | $16,724 | −83.3% |
| 2011 (partial recovery) | 6.81 | $78,007 | −22.0% |
Even by 2011, three decades on, a peak buyer was still down more than 20 percent in real terms. The nominal chart told a gentler story than the purchasing-power one. Gold fell from about $850 an ounce in 1980 to roughly $293 by March 2002, a drop near 65 percent before inflation is even stripped out.
📚 Source: CBS News / Swedroe, gold’s post-1980 nominal decline · cbsnews.com
| Year | Real value (USD) |
|---|---|
| 1980 | $100,000 |
| 1985 | $32,875 |
| 1990 | $33,792 |
| 2001 | $16,724 |
| 2011 | $78,007 |
Sensitivity table (9 rows)
These nine scenarios vary only the entry year or the holding window, so the gold/CPI ratio at purchase becomes the single lever moving every result.
| Scenario | What changed | Real value of $100,000 | Δ vs base ($16,724) |
|---|---|---|---|
| 1980 peak (base, hero) | Setup: P=$100K, entry 1980, ratio 8.73, exit 2001, end ratio 1.46 | $16,724 | base |
| 1975 entry | entry 1975 / ratio 3.36 | $43,452 | +$26,728 |
| 1977 entry | entry 1977 / ratio 2.50 | $58,400 | +$41,676 |
| 1985 entry | entry 1985 / ratio 2.87 | $50,871 | +$34,147 |
| 1990 entry | entry 1990 / ratio 2.95 | $49,492 | +$32,768 |
| Exit 1985 | exit 1985 / end ratio 2.87 | $32,875 | +$16,151 |
| Exit 1990 | exit 1990 / end ratio 2.95 | $33,792 | +$17,068 |
| Exit 2001 (trough) | exit 2001 / end ratio 1.46 | $16,724 | base |
| Exit 2011 | exit 2011 / end ratio 6.81 | $78,007 | +$61,283 |
$32,768: the gap between buying at the 1980 peak and buying a decade later at a normal valuation (1990, ratio 2.95). The entry gold/CPI ratio governed the real outcome.
Gold Real-Value Decline Calculator
Enter a lump sum and an entry and exit year to see what gold held in real, inflation-adjusted dollars.
Real value = lump sum × (exit gold/CPI ratio / entry gold/CPI ratio), on the Erb-Harvey real gold/CPI series. Defaults show the 1980 peak held to the 2001 trough. Educational estimate, not advice.
Run your own entry year against the long-run average near 3.2, and the pattern repeats: what you pay relative to that mean sets the result. The same two decades could have earned ordinary compound interest those years had to offer elsewhere.
Soren put $100,000 into gold. The goal was inflation protection. Twenty years on, real value sat at $16,724. Protection had quietly evaporated.
When Soren finally sold, the numbers were grim. There was no real gain left to tax, just the slow tax and cost friction that wears on any long-held asset.
On paper nothing had changed, but its real worth had thinned to a sliver.
📚 Source: Erb & Harvey, 2013 (real gold/CPI ratio 8.73 to 1.46) · nber.org
Soren’s $100,000 quietly drains to a fraction of its real worth over twenty years of waiting.
How Should You Actually Use Gold Against Inflation?
If gold ever earns its place, it earns it here, in the rare shock the last section hinted at.
Gold is not useless against inflation; it works in a narrow set of conditions. Dirk Baur’s research finds gold reacts strongly to large, sudden inflation shocks rather than to ordinary, moderate inflation. During the 1970s stagflation decade gold rose far faster than the cost of living, and it surged again from 2020 through 2025.
Over century-long spans it has roughly held its purchasing power, the original golden-constant idea. The honest takeaway is that gold can serve as crisis insurance and a diversifier, not as a dependable everyday inflation hedge.
The most recent real-world test made the point again. When U.S. inflation ran to a forty-year high, gold did not do the job most buyers expected.
During the 2021 to 2024 inflation cycle, gold did not behave like a clean short-term CPI hedge. Consumer prices peaked at 9.1 percent year over year in June 2022, yet gold had already topped near $2,050 in March 2022 and then fell about 20 percent over the next seven months, bottoming around $1,625 that October as the Federal Reserve raised rates. Gold rallied hard only later, in 2023 and 2024, after inflation was already cooling.
What actually tracked inflation in real time were the CPI-linked instruments. Series I savings bonds paid a 9.62 percent annualized composite rate for purchases from May to October 2022, moving directly with the consumer price index while gold sagged.
| When | CPI (year over year) | What gold did |
|---|---|---|
| March 2022 | Rising toward the peak | Cycle high near $2,050 |
| June 2022 (inflation peak) | 9.1 percent, a 40-year high | Falling; down toward $1,800 |
| October 2022 | Still above 7 percent | Trough near $1,625 (about −20% from March) |
| 2023–2024 | Cooling back toward target | Rallied to new highs |
📚 Sources: BLS CPI (inflation path) · CME Group / Forbes (gold 2022 price path) · U.S. Treasury (I bond 9.62% composite rate)
The timing is the tell. Gold sank while inflation peaked and rose while inflation faded, the opposite of what a clean CPI hedge would do. It is one more case where the story and the mechanism part ways.
Shifting from real-dollar losses, the picture changes once we isolate genuine inflation shocks. Four practical steps turn that into a position you can actually hold.
Step 1: Check where your gold is held
Check whether your gold sits in a taxable account or an IRA. Under IRC Section 408(m), physical gold and physically backed funds such as GLD are generally treated as collectibles, so long-term gains may face a rate of up to 28 percent rather than the standard long-term capital gains ceiling. Location changes the after-tax result.
Where you hold gold matters, because inside a Roth or traditional IRA the collectibles rate that bites a taxable account does not apply the same way. This analysis covers U.S. dollar gold priced against U.S. CPI. IRA treatment is different, but it is not automatically tax-free: the outcome depends on the account type, the distribution rules, and whether the metal qualifies under IRC Section 408(m)(3).
📚 Source: IRC Section 408(m)(2), collectibles long-term gain rate · law.cornell.edu
The 28 percent is a ceiling, not a flat charge. You pay the lower of your ordinary rate or 28 percent, and higher earners can owe the 3.8 percent net investment income tax on top.
Step 2: Measure gold’s real price against its average
Measure today’s gold-to-CPI ratio against its historical mean of roughly 3.2 from Erb and Harvey. Buying far above that mean, as 1980 buyers did at 8.73, has historically preceded weak real returns. Valuation at entry has mattered more than the inflation forecast.
Step 3: Right-size gold to a diversifier slice
Right-size gold to a small diversifier slice rather than a core inflation hedge. Baur’s 2025 study shows gold reacts mainly to large inflation shocks, not ordinary inflation, so a modest allocation captures the crisis benefit without betting a retirement on it.
Step 4: Use TIPS or I bonds for steady protection
Use Treasury inflation-protected securities or I bonds for steady inflation protection. Both adjust principal or rate directly to the consumer price index, doing the everyday job gold cannot. Reserve gold for the rare shock and currency-collapse cases where it has actually delivered.
For steady protection it helps to understand how bonds work, since TIPS and I bonds adjust their principal directly to the CPI.
Gold/CPI ratio at or under roughly 3.2
A modest slice, not the bulk of the portfolio
May avoid the taxable-account collectibles rate, if eligible
All three PASS: gold can play a sensible supporting role. Any FAIL: lean on TIPS or I bonds for the inflation job instead.
The interactive Gold Real-Value Decline Calculator above lets you test any entry and exit year against this same ratio logic.
Forum and comment threads keep circling the same puzzle: gold rallying to fresh highs even as inflation cooled back toward normal, which is hard to square with a clean hedge story.
If gold only works during extreme inflation shocks, then holding some before the shock arrives is the whole point of insurance.
Moving eligible gold into an IRA, or trimming it to a small slice, can soften the collectibles-rate hit on future taxable gains.
Who Should Use a Different Approach?
In the minority of periods marked by sudden, large inflation shocks, gold has reacted strongly and can earn its place as insurance. Two windows show the exception clearly:
- The 1970s stagflation decade, when gold rose far faster than the cost of living.
- The 2020 to 2025 surge during pandemic-era inflation and rate fears.
Treat gold as a small crisis hedge or diversifier, and use TIPS or I bonds for steady inflation protection.
Next time someone calls gold an inflation hedge, ask: over which horizon, and at what real price?
We will update this when the real gold/CPI ratio falls back beneath its historical mean of about 3.2.
Gold and Inflation: Frequently Asked Questions
The short answers below converge on one theme: gold’s inflation protection is real but conditional. Over typical investing horizons it has not reliably tracked the cost of living, which is why a 1980-peak buyer lost about 83 percent in real terms. Gold tends to earn its keep during sharp inflation shocks and over very long periods, not during ordinary inflation. For steady, predictable protection, Treasury inflation-protected securities and I bonds do the job gold cannot. Account location matters too, since some taxable gold gains may face the collectibles rate, up to 28 percent.
Frequently Asked Questions
Is gold a good hedge against inflation?
Gold is a good hedge against inflation only under narrow conditions, not as a general rule. Across the 1971 to 2025 record, gold did not reliably beat inflation in any single month, quarter, or year, according to Dirk Baur’s 2025 study. Its real, inflation-adjusted price behaves more like a valuation ratio than a steady store of worth, drifting back toward a long-run average. Where gold has earned its reputation is during sudden, large inflation shocks and over century-long spans. For an ordinary investor holding it across a five to twenty year window, gold has been an unreliable shield. Treasury inflation-protected securities and I bonds track the consumer price index far more directly.
Does gold keep up with inflation over time?
Gold does not keep up with inflation dependably over time, despite the popular story. The World Gold Council reports that, across 1971 to 2020, only about 16 percent of gold’s price movement is explained by changes in the consumer price index. Someone who bought at gold’s January 1980 real peak watched purchasing power fall by roughly 83 percent over the following two decades, a stretch reaching into 2001. Most of gold’s apparent inflation tracking traces to a single explosive decade rather than steady protection. Over very long, century-plus horizons gold has roughly held its real value, the original golden-constant idea. Over the horizons real investors actually use, that long-run average offers little comfort.
Why did gold lose value after 1980?
Gold lost value after 1980 because its real price had reached an extreme that historically reverses. Erb and Harvey (2013) measured a gold-to-inflation ratio that averages near 3.2, and in January 1980 it stood at 8.73, far above that mean. When the ratio sits that high, the years that follow have tended to deliver weak real returns as the price drifts back toward average. The decline was not a single crash but a slow, grinding repricing that stretched across two decades. Five years in, gold had already shed about 67 percent of its real value. The starting valuation set the outcome.
Is gold or stocks a better inflation hedge?
Stocks have generally been stronger long-run real wealth builders than gold, though they are not direct CPI-linked hedges. Across the same fifty years, broad equity baskets like the S&P 500 compounded real wealth more steadily than gold, which depends on rare shock decades to perform. Gold pays no earnings and produces no cash flow, so its real return rests entirely on what the next buyer will pay. Stocks, by contrast, grow with corporate earnings that tend to rise alongside the cost of living. Gold can still serve as a small crisis diversifier, since it sometimes zigs when equities zag. For steady, everyday inflation protection, though, a diversified stock portfolio has done the job gold could not.
Are TIPS a better inflation hedge than gold?
TIPS are a more direct inflation hedge than gold for most investors seeking steady protection. Treasury inflation-protected securities adjust their principal to the consumer price index, so their value rises mechanically with measured inflation, and I bonds work on a similar CPI-linked rate. Gold offers no such link. Its real price mean-reverts and can fall for years while inflation runs hot. There is also a tax angle that practitioners weigh. Physical gold and physically backed funds such as GLD are generally treated as collectibles under IRC Section 408(m). Long-term gains may face a rate of up to 28 percent rather than the standard long-term capital gains ceiling, while TIPS held in a tax-advantaged account avoid that premium. The practical split many advisors use is TIPS or I bonds for reliable inflation coverage and a small gold sleeve reserved for genuine crisis and currency-collapse scenarios.
Is Gold an Inflation Hedge? The Bottom Line
Soren’s $83,276 loss was only part of it, alongside twenty years of waiting.
The mechanism is the whole argument. Erb and Harvey showed that gold’s real price behaves like a valuation multiple, expensive at the start meaning thin returns ahead. Baur found the inflation link mostly fires in rare shocks, not in ordinary years. Buy gold cheap relative to its long-run average and it can reward patience. Buy it expensive, as 1980 buyers did, and the metal spends years working against you while prices climb past it.
Held in a taxable account, that same gold may face the collectibles rate on long-term gains, up to 28 percent.
Check where your gold is held today. In a taxable brokerage, long-term gains may face the collectibles rate, up to 28 percent.
Gold’s one promise is to hold real value, yet the years people bought it for protection were the years it shed the most.
The deepest cost was not the 83 percent Soren could see on a statement, but the two decades of compounding they gave up waiting for a hedge that only fired in shocks.
You are right to fear inflation; you may be wrong about which asset answers it.
If gold is not the answer, the next question is which inflation you face.
At 70, Soren wants resilience, not a story that only paid off in crises.
Held with clear eyes, gold can be ballast in a storm. It was rarely the inflation shield Soren first reached for.
Your turn
What did you first buy gold to protect against, and over what horizon?
Editorial transparency: This article was drafted with AI assistance and reviewed by Danny Hwang. All calculations were independently verified in Python (notebook available on request). All citations were manually checked against primary sources.
Update History
- 2026-07-01: Corrected nominal-decline figure to about 65 percent (matching the CBS/Swedroe source); clarified that the 83 percent figure is the real gold/CPI ratio decline; specified the 1971–2020 window for the World Gold Council 16 percent statistic; softened IRA tax wording to reflect IRC Section 408(m) eligibility and distribution rules; added the real-interest-rate mechanism and its post-2022 decoupling; added the 2021–2024 inflation-surge case; dated the 2026 valuation reading.
- 2026-06-30: Published.