
📅 Originally Published: · Last Updated:
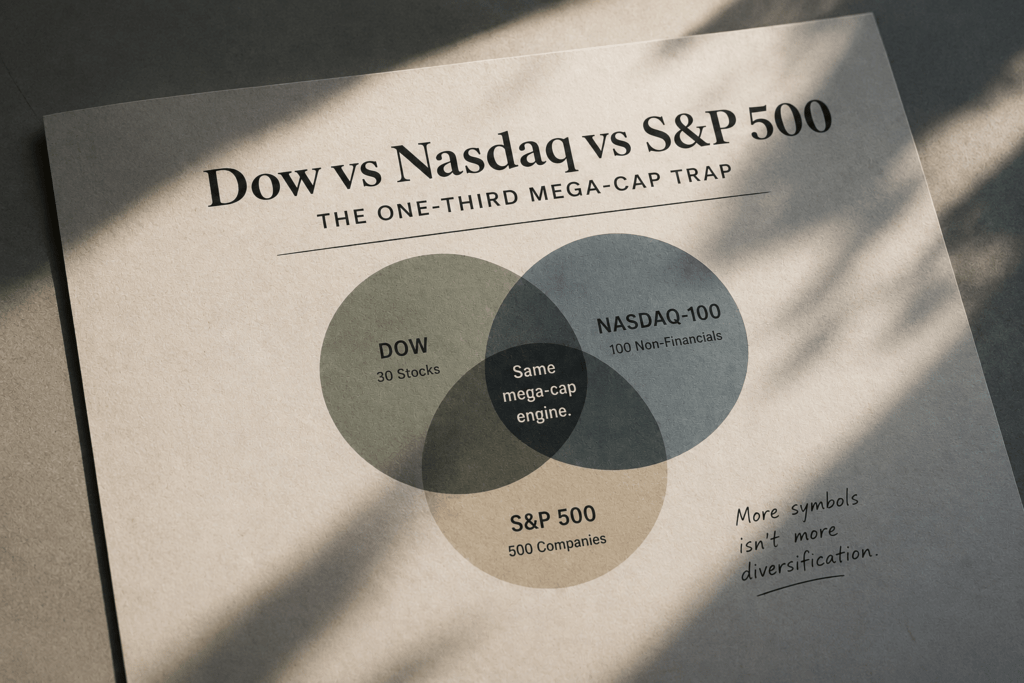
Answer first: Among the Dow, Nasdaq-100, and S&P 500, the S&P 500 is usually the strongest broad U.S. core; QQQ is better treated as a concentrated growth tilt, while DIA is a 30-stock price-weighted sleeve. Using Vanguard and Invesco issuer fact sheets dated June 2026, an even VOO-QQQ blend placed about one-third in seven shared mega-cap companies. That is a selected-company measure, not the funds’ total overlap. Before adding QQQ or DIA, decide what exposure the second fund adds that VOO does not.
For readers comparing dow vs nasdaq vs sp500, the real choice is not between three labels for the same market. Each index starts with a different company universe and uses a different weighting rule. Those design choices determine which businesses drive returns and how much concentration sits beneath the ticker.
The S&P 500 includes 500 leading companies and covers about 80% of available U.S. market capitalization. The Nasdaq-100 is designed to measure 100 of the largest eligible non-financial companies listed on Nasdaq and uses modified market-cap weighting. The Dow Jones Industrial Average contains 30 companies and weights them by share price.
An ETF is a wrapper around its holdings. Owning VOO and QQQ creates two fund positions, but it does not create two independent sets of businesses. Start with what a stock represents and how an ETF passes its underlying holdings into your portfolio. Looking through the wrappers makes the shared exposure easier to see.
Which Index Fits Which Role?
The practical verdict is about portfolio role, not a universal winner. Among these three, the S&P 500 offers the broadest starting point. The Nasdaq-100 adds a deliberate growth-heavy tilt. The Dow remains useful as a familiar market barometer, but its narrow, price-weighted construction makes it a less complete foundation for a U.S. equity allocation.
| Index | Common ETF proxy | Construction | What it emphasizes | Most defensible role |
|---|---|---|---|---|
| S&P 500 | VOO, SPY, IVV | 500 leading U.S. companies, float-adjusted market-cap weighted | Large U.S. companies, with more weight in the largest firms | Broad U.S. large-cap core |
| Nasdaq-100 | QQQ, QQQM | Designed around 100 large Nasdaq-listed non-financial companies, modified market-cap weighted | Growth, technology, communication services, and other Nasdaq leaders | Intentional growth tilt |
| Dow Jones Industrial Average | DIA | 30 selected U.S. companies, price weighted | Higher-priced shares, regardless of company market value | Headline benchmark or narrow blue-chip sleeve |
Broader does not mean evenly spread. S&P Dow Jones Indices reported that the 10 largest S&P 500 companies represented almost 40% of the index by mid-2025, the highest concentration since the mid-1960s. That is a reason to inspect the core, not a reason to assume QQQ or DIA automatically diversifies it.
Does Nasdaq Mean the Nasdaq-100 or the Nasdaq Composite?
This comparison uses the Nasdaq-100, represented by QQQ or QQQM. It does not use the Nasdaq Composite. Investors often shorten both names to Nasdaq, but the indexes answer different questions.
The Nasdaq Composite includes domestic and international common stocks listed on the Nasdaq Stock Market. The Nasdaq-100 is the narrower investable benchmark built around the largest eligible non-financial Nasdaq-listed companies. An index may be designed around 100 companies while an ETF reports more securities because multiple share classes and index maintenance rules can increase the line-item count. Invesco’s June 30, 2026 QQQ fact sheet listed 103 holdings.
Terminology check: QQQ tracks the Nasdaq-100, not the Nasdaq Composite and not a pure technology-sector index. It spans several industries, but its largest holdings still make the fund growth-heavy and top-heavy.
How Does Each Index Weight Companies?
A constituent list tells you what an index owns. The weighting method tells you what is most likely to drive its return.
S&P 500: broad, but led by the largest companies
The S&P 500 uses float-adjusted market capitalization weighting. A company with more publicly investable market value receives a larger index weight. This gives the benchmark a clear economic logic, but it also allows a small group of giant companies to dominate when their market values rise faster than the rest of the index.
Vanguard’s VOO fact sheet dated June 30, 2026 listed 506 stocks and placed 37.9% of fund assets in its 10 largest holdings. The remaining exposure still reached hundreds of companies across every major U.S. sector.
Nasdaq-100: modified market-cap weighting inside a narrower universe
The Nasdaq-100 begins with a narrower universe of large non-financial companies listed on Nasdaq. It then applies modified market-cap weighting, including caps and scheduled rebalancing rules. Those controls limit unconstrained concentration, but they do not make the holdings equal weighted.
Invesco’s QQQ fact sheet dated June 30, 2026 listed 103 holdings. Its 10 largest line items totaled 47.84% by direct addition, compared with 37.9% for VOO. QQQ can be useful when that extra concentration is intentional. It is a poor substitute for a broad core when the investor assumes a three-digit holding count means evenly distributed risk.
Dow: share price determines influence
The Dow is price weighted. A component with a higher share price has more influence on the index than a lower-priced component, even when the lower-priced company has a larger market value. A stock split can therefore reduce a company’s Dow weight without changing the value of the underlying business.
That construction is historically important and easy to follow, but it is not a complete map of the U.S. market. DIA can add a distinct 30-stock sleeve. It should not be mistaken for the missing diversification inside VOO and QQQ.
What Does the VOO and QQQ Overlap Math Show?
The cleanest way to illustrate overlap is to name the company group and expose every input. This calculation uses seven companies that appeared among the largest holdings in both June 30, 2026 issuer fact sheets: NVIDIA, Apple, Alphabet, Microsoft, Amazon, Broadcom, and Tesla.
| Shared company | VOO weight | QQQ weight |
|---|---|---|
| NVIDIA | 7.50% | 7.60% |
| Apple | 6.60% | 6.67% |
| Alphabet | 5.80% | 6.29% |
| Microsoft | 4.30% | 4.35% |
| Amazon | 3.60% | 4.03% |
| Broadcom | 2.80% | 2.81% |
| Tesla | 1.80% | 3.30% |
| Seven-company total | 32.40% | 35.05% |
For a portfolio split evenly between the two funds, the calculation is:
The 33.73% result is not the total overlap between VOO and QQQ. The funds share many additional companies. The selected group isolates the mega-cap exposure most likely to make two separate tickers move together.
The top-10 figures answer a different question. A 50/50 blend of VOO’s 37.9% and QQQ’s 47.84% top-10 concentrations produces 42.87%. That figure describes how much of each fund sleeve sits in its own top 10, not the portfolio’s unique shared-company overlap. Treating it as overlap would double-count the concept and overstate what the evidence shows.
📌 KEY TAKEAWAYS
- The dated scale is roughly one-third: the same-date calculation produced 33.73% in the selected seven companies.
- Selected-company exposure is not total overlap: additional shared holdings sit outside this group.
- Top-10 concentration is a separate metric: it measures how top-heavy each fund sleeve is.
- Two tickers can share one risk driver: the weights underneath the funds matter more than the line count in a brokerage account.
What Does That Concentration Mean in a Portfolio?
Overlap is not automatically bad. It becomes a problem when the portfolio label and the economic exposure disagree. An investor who adds QQQ to increase growth exposure has made a coherent choice. An investor who adds QQQ because the account needs a second independent core has misunderstood what the second fund changes.
| Portfolio | What it appears to be | What the holdings imply | More accurate label |
|---|---|---|---|
| 100% VOO | One broad U.S. fund | Broad large-cap exposure with meaningful mega-cap concentration | U.S. large-cap core |
| 80% VOO / 20% QQQ | Core plus a second index | Broad core with a measurable growth overweight | Core plus growth tilt |
| 50% VOO / 50% QQQ | Two equally diversified funds | A larger bet on companies and sectors that dominate both funds | Concentrated large-cap growth blend |
| VOO + QQQ + DIA | Three major U.S. indexes | Three U.S. large-cap sleeves with different rules but limited market completion | U.S.-only index stack |
This matters during a leadership reversal. VOO and QQQ can decline together when their shared mega-cap positions weaken. DIA may behave differently because of its constituent mix and price weighting, but 30 stocks do not automatically add the international, small-cap, value, or fixed-income exposure the portfolio may lack.
Concentration can help while the same market leaders keep outperforming. It also makes the portfolio more dependent on that leadership continuing. The risk is not that a tilt exists; it is that the investor mistakes the tilt for neutrality.
How Should an Investor Choose?
Start with the job each fund must perform. There is no evidence-based QQQ cap that fits every investor, so a universal 15% or 20% rule would create false precision. A written role and rebalancing boundary are more useful.
1. Choose the core before adding a tilt
If the goal is broad U.S. large-cap exposure, an S&P 500 ETF is usually the most direct of these three choices. Implementation still matters, including expense ratio, tracking, taxes, and trading costs. The guide to investing in S&P 500 ETFs covers that next step.
2. State what QQQ is supposed to add
QQQ needs a reason beyond recent performance. A valid reason could be a deliberate overweight to the Nasdaq-100’s growth-heavy companies. Write the maximum allocation and the rebalancing rule before the position grows. That makes the fund an intentional satellite rather than an accidental second core.
3. Diversify with a different risk source
Another U.S. large-cap index cannot fully solve excessive U.S. large-cap concentration. International stocks, smaller companies, value stocks, high-quality bonds, cash equivalents, or real assets may change the portfolio’s risk more directly. The appropriate mix depends on time horizon, account type, loss tolerance, and the purpose of the money.
The 100% U.S. portfolio analysis separates geographic concentration from the narrower decision among VOO, QQQ, and DIA.
4. Recheck the holdings, not only the returns
Review top holdings, sector weights, and shared-company weights when you rebalance. Indexes reconstitute and funds publish updated holdings, so a concentration estimate can drift even when the ticker symbols stay the same. The goal is to keep each fund aligned with the role you assigned to it.
Portfolio check: If adding an ETF mostly increases positions you already own, record it as a tilt. A diversifier should change the portfolio’s economic exposure, not merely add another line to the account screen.
FAQ: Dow vs. Nasdaq-100 vs. S&P 500
Is the S&P 500 better than the Nasdaq-100?
For a broad U.S. large-cap core, the S&P 500 is usually the more complete of the two because it spans every major sector and covers about 80% of available U.S. market capitalization. The Nasdaq-100 can suit an investor who knowingly wants more exposure to its largest growth-heavy companies. The S&P 500 is broader; the Nasdaq-100 is the stronger tilt.
Is owning VOO and QQQ together a mistake?
No. The combination becomes misleading when the investor treats both funds as independent diversified cores. VOO plus a smaller QQQ allocation can express a clear core-and-tilt strategy. A 50/50 split makes a much larger bet on companies that already carry substantial weight in both funds. Check the shared-company weights and rebalance to a written target.
Does adding DIA diversify VOO and QQQ?
DIA changes the weighting rule and adds a 30-stock blue-chip sleeve, so it is not identical to VOO or QQQ. It still leaves the portfolio concentrated in U.S. large companies and does not provide broad international, small-cap, or bond exposure. DIA may change the mix at the margin, but it is not complete market diversification.
Why can a Nasdaq-100 ETF list more than 100 holdings?
The index is designed around 100 eligible companies, but a fund can report more securities because a company may have multiple share classes and index maintenance rules can temporarily affect the line-item count. Invesco’s QQQ fact sheet listed 103 holdings as of June 30, 2026. The index design and the fund’s security count are related, but they are not always identical.
Bottom Line: Which Index Should Be the Core?
Among these three indexes, the S&P 500 is usually the strongest default core. The Nasdaq-100 is a concentrated growth tilt. The Dow is a narrow price-weighted benchmark that can be held intentionally, but it does not complete the market.
The same-date overlap illustration does not prove that VOO and QQQ should never be combined. It shows that combining them increases a shared mega-cap bet. Before adding a second index fund, write down the exposure it is supposed to add, then check whether its largest holdings actually deliver it.
- How to Invest in S&P 500 ETFs for choosing and implementing a core fund.
- What Is an ETF? for understanding how fund wrappers and holdings interact.
- 100% U.S. Portfolio for the geographic concentration question beyond these three indexes.
- Stocks vs. Real Estate for a broader comparison of wealth-building risk sources.
Your turn
Open your two largest equity ETFs and list the companies that appear in both top-holdings tables.
Then ask whether the second fund changes your risk or mainly increases positions you already own.
- S&P 500 scope and weighting: S&P 500 index page and S&P U.S. Indices Methodology.
- Nasdaq-100 scope and weighting: Nasdaq-100 Index Methodology and Invesco QQQ product page.
- Dow construction: Dow Jones Averages Methodology.
- VOO snapshot: Vanguard S&P 500 ETF fact sheet, dated June 30, 2026. It listed 506 stocks, 37.9% in the top 10, and 32.40% in the seven-company group used here.
- QQQ snapshot: Invesco QQQ ETF fact sheet, dated June 30, 2026. It listed 103 holdings, 47.84% across the 10 largest line items, and 35.05% in the same seven-company group.
- Concentration context: S&P DJI’s concentration research reported that the largest 10 S&P 500 companies represented almost 40% of the index by mid-2025.
Update history
- v1.0 2025-12-28 PUBLISH
Original publication.
- v1.1 2026-03-19 UPDATE
Added index-overlap analysis and concentration figures.
- v2.0 2026-07-11 REMEDIATION
Refreshed the comparison structure, internal links, and bottom trust package.
- v2.1 2026-07-12 FACT CHECK
Clarified shared-company exposure, top-10 concentration, and Nasdaq-100 terminology.
- v2.2 2026-07-31 DATA ALIGNMENT
Aligned VOO and QQQ data to June 30, 2026, exposed the company-level inputs, corrected canonical links and disclosure markup, and regenerated the SEO package.