
📅 Last Updated: · Data snapshot: current Robinhood and Webull help and pricing pages, Q2 2026 order-routing disclosures, SEC enforcement records, SIPC guidance, and the 2022 peer-reviewed Robinhood behavior study.
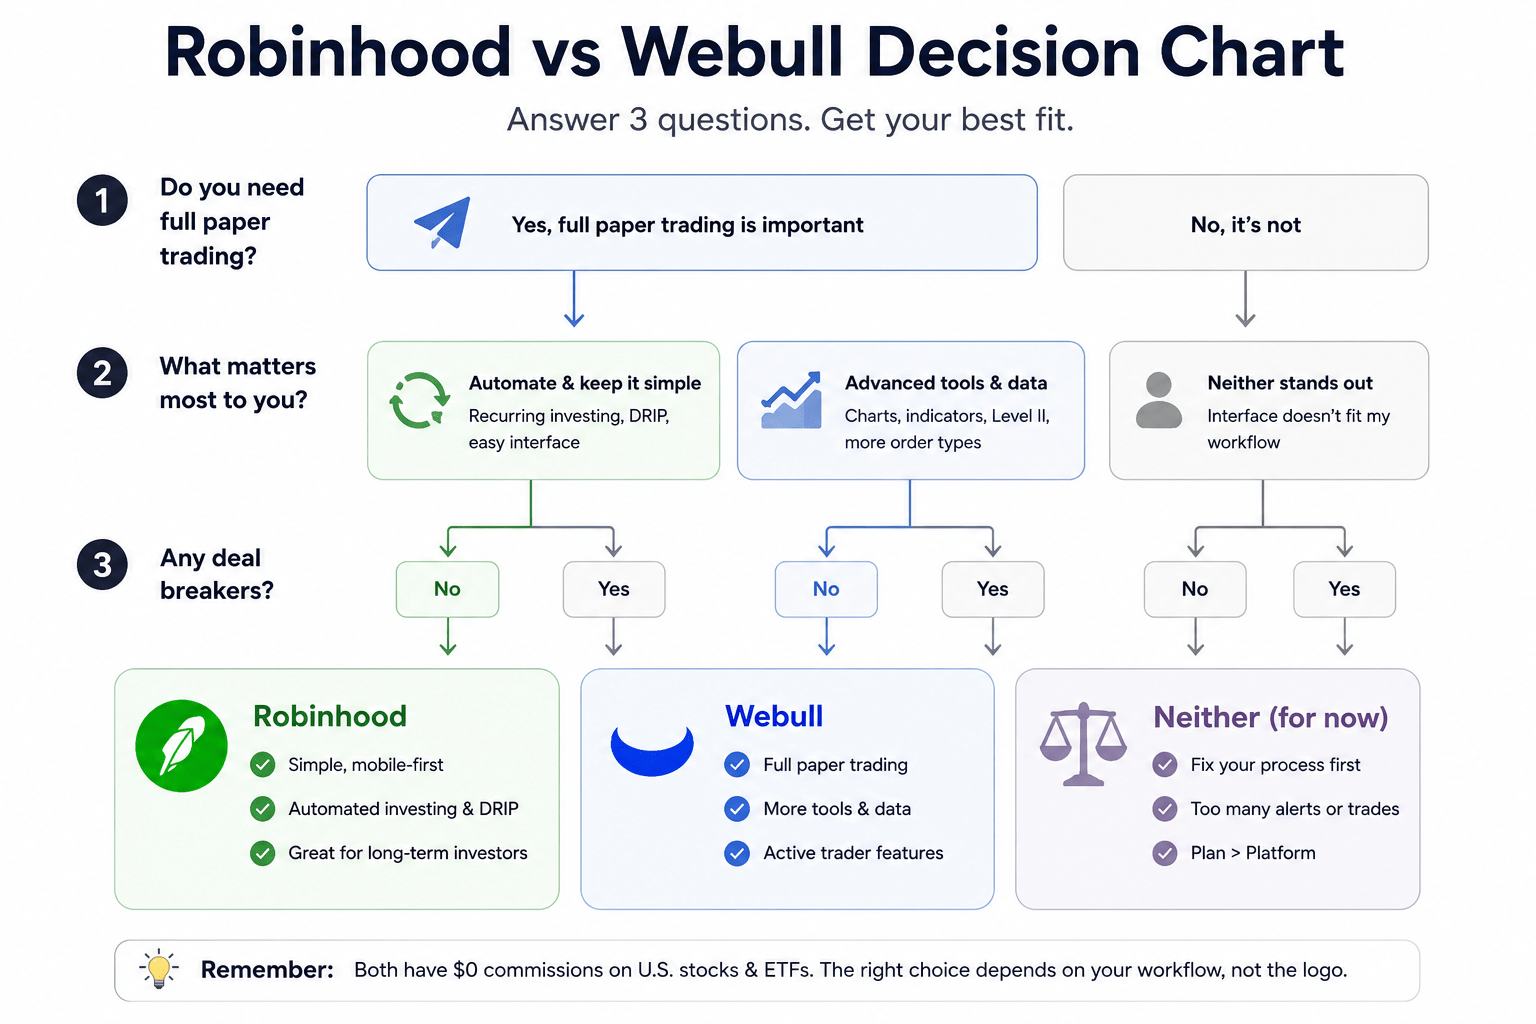
Robinhood vs Webull is no longer a simple choice between an easy investing app and an advanced trading app. Both support recurring investing, dividend reinvestment, charts, indicators, alerts, and market data. Webull has the clearer edge if you want a full paper account for practice. Robinhood has an options tool called Simulated Returns, but it is narrower than a paper brokerage account. For most investors, the better choice comes down to the account and assets you need, the tools you will actually use, transfer costs, and which interface makes it easier to follow your plan.
Robinhood vs Webull: which app is the better fit?
Either broker can support a low-frequency stock or ETF plan with recurring purchases and dividend reinvestment. Both also provide charting tools that are far more capable than the old “Robinhood is simple, Webull is advanced” shorthand suggests.
The clearest workflow difference is practice trading, where Webull offers a full paper account across several asset types. Robinhood does not offer a comparable paper brokerage account in the materials reviewed for this update. Its Simulated Returns tool models possible options outcomes instead. That can help with options analysis, but it is not the same product.
| Category | Robinhood | Webull | What should decide it? |
|---|---|---|---|
| Recurring purchases | Automated stock and ETF investments on a selected schedule. | Recurring investments for eligible assets and supported schedules. | Check the exact security, account, funding method, and order timing you plan to use. |
| Dividend reinvestment | DRIP for eligible dividend-paying stocks and ETFs that support fractional shares. | DRIP for eligible securities in supported self-directed accounts. | Neither platform owns the automation advantage. |
| Charts and indicators | Advanced charts in the app and more than 50 indicators in Legend. | Customizable charts and technical indicators across app, desktop, and web tools. | Pick the layout that answers a question you defined before you logged in. |
| Practice trading | No full paper brokerage account was identified. Simulated Returns models hypothetical options outcomes. | Paper trading uses virtual funds and supports stocks, ETFs, options, crypto, futures, and events. | Webull is the clearer fit if simulated practice is a real requirement. |
| Stock and ETF commissions | Advertises $0 commissions for eligible U.S. stock and ETF trades. Other charges can apply. | Advertises $0 commissions for U.S.-listed stocks and ETFs. Other charges can apply. | Read the fee schedule for the products and services you will use. |
| Outgoing account transfer | $100 for an outgoing account transfer, based on the current support page. | $75 for a full or partial outgoing transfer, based on the current support page. | This matters most if you expect to move the account later. Recheck the fee before acting. |
| Order-routing transparency | Publishes quarterly routing reports. The current disclosure checked for this update covers Q2 2026. | Publishes quarterly routing files. Its archive lists Q2 2026 above Q1 2026. | The reports show routing relationships and incentives, not a universal execution winner. |
| Custody protection | Eligible brokerage assets receive SIPC protection within applicable limits. | Eligible brokerage assets receive SIPC protection within applicable limits. | SIPC addresses missing assets after a brokerage failure. It does not cover market losses. |
Warning: Commission-free does not mean cost-free. A trade can still carry a bid-ask spread, execution risk, regulatory charges, margin interest, taxes, or the cost of trading more often than your plan requires.
Webull is the stronger fit when full paper trading or its denser workflow serves a defined process. Robinhood can fit an investor who prefers its interface and finds the needed account, assets, and controls there. The $25 difference in the current outgoing transfer fee is real, but it should not outweigh a larger mismatch in account features or behavior. Recurring investing, DRIP, charting, and indicators are shared capabilities, so they should not decide the comparison by themselves.
What does “free trading” leave out?
A $0 commission removes one visible charge, but it does not remove every cost or broker incentive. Brokers can earn money from order routing, margin lending, securities lending, cash programs, subscriptions, options, crypto, and other services. Payment for order flow is legal in the United States. The issue is the conflict it can create when a broker is paid by a venue that receives customer orders.
The strongest historical warning comes from the SEC. In a 2020 enforcement action, the agency found that certain Robinhood orders from October 2016 through June 2019 lost about $34.1 million in price improvement compared with competing retail brokers after the SEC accounted for the commissions those brokers charged.
$34.1M
The SEC’s estimated historical price-improvement shortfall for certain Robinhood orders from October 2016 through June 2019, net of competing brokers’ commissions.
Keep that finding inside the dates and conduct covered by the SEC order. It does not prove that every current Robinhood order gets a poor fill, and it does not tell us how Webull would have performed on the same orders.
What do routing reports reveal?
SEC Rule 606 requires public information about order routing and material payment or profit-sharing relationships that may affect routing. The reports are technical, but they expose incentives that a feature page does not.
Robinhood’s current routing disclosure, checked on August 28, 2026, identifies the report as Q2 2026 in the current document text. It says Robinhood Securities passes 80% of third-party market-center revenue to Robinhood Financial under a revenue and cost allocation agreement. It also describes spread-based payments for many equity orders.
Webull’s public routing archive lists a Q2 2026 package dated July 30, 2026. These disclosures do not rank the brokers for every order. They give investors a place to inspect routing relationships instead of assuming that a $0 commission answers the execution question.

In plain English
A market center may pay a broker for customer order flow. The broker still owes customers best execution. The payment creates a conflict worth watching, not automatic proof of a bad fill. Compare current disclosures, use order types you understand, and avoid turnover that your plan does not require.
What happens after you tap buy?
Your order still has to be routed and filled. The result depends on the market, liquidity, order type, timing, and execution quality. A market order puts speed first. A limit order sets the worst price you will accept, but it may not fill.
The bid is the highest displayed buy price, and the ask is the lowest displayed sell price. The gap between them is the bid-ask spread. It can be tiny in a heavily traded ETF and much wider in a thin or fast-moving security.
This is where the platform debate becomes less important than the order itself. Better charts do not rescue a rushed market order in a thin security. A cleaner interface does not make an oversized position sensible. Security choice, position size, order type, and the ability to walk away often matter more.
How can small frictions become meaningful?
Take an intentionally high-turnover example in which a $10,000 account makes 50 transactions, each with notional value equal to the starting account. Assume five basis points, or 0.05%, of friction on each transaction. This is not a fee estimate for Robinhood or Webull. It only shows what repeated turnover does to the measurement base.
Trading Friction Scenario Calculator
Estimate how a small per-trade friction assumption can add up as your turnover rises. This is a scenario tool, not a measure of actual Robinhood or Webull execution quality.
The example multiplies 50 transactions by $10,000 of notional to get $500,000 of total traded notional. Five basis points of that amount is $250. Dividing $250 by the original $10,000 account gives 2.5%. The example ignores changing position sizes, gains, losses, taxes, and compounding. It does not estimate either broker’s average spread or execution cost.
Keep the two denominators separate because the assumed rate is 0.05% of cumulative traded notional, while the $250 result equals 2.5% of the original account. Lower turnover, smaller trades, or tighter spreads would reduce the example; higher turnover or worse liquidity would increase it.
What does the Robinhood behavior study actually show?
The study found a dated pattern of attention-driven buying, not a 4.7% loss for every Robinhood user. The 2022 Journal of Finance paper by Barber, Huang, Odean, and Schwarz used Robintrack data from May 2018 through August 2020.
The authors focused on strong daily jumps in Robinhood ownership. Their main herding measure selected the top 0.5% of positive user-change ratios each day among stocks that had at least 100 Robinhood users on the prior day. Average 20-day abnormal returns after those events were about -4.7%.
-4.7%
Average 20-day abnormal return after the study’s top daily Robinhood herding events in the May 2018 through August 2020 sample. This is not a fee or an expected return for every user.
The paper also found that Robinhood outages reduced trading more in high-attention stocks. That supports a warning about crowded buying after attention spikes. It does not prove that opening a Robinhood account causes a 4.7% loss.
The study did not test Webull, so its estimate should not be copied onto Webull users. This is behavioral evidence, not proof that Robinhood is the worse broker. The useful lesson is broader: alerts, mover lists, social signals, and complex screens can pull attention away from a written plan.
How should a beginner configure either app?
Set up the account around the behavior you want before you fund it. Decide whether you need margin, remove permissions you cannot justify, cut noisy alerts, automate planned investments, and use a short order checklist. The goal is to make planned actions easy and impulsive actions harder.
1. Limit permissions and noisy alerts
If you do not need borrowed money, leave margin investing off. Robinhood documents how to disable margin investing, while Webull’s responsible-trading guidance tells users to review permissions when trading becomes unhealthy. Options, short selling, and margin are tools, not levels you need to unlock. If your plan is to buy broad ETFs, extra permissions mostly create more ways to drift from that plan.
Keep alerts for security, deposits, withdrawals, and completed orders, but be more skeptical of top movers, price spikes, social activity, and promotions. Ask whether you would still want an alert if you were not allowed to trade for 24 hours. If the answer is no, the alert may be creating urgency rather than helping your plan.
2. Put the plan outside the brokerage app
Write down your target allocation, eligible investments, contribution schedule, rebalancing rule, maximum position size, and reasons for selling. An investment policy statement gives the app a narrow job: execute decisions made before the screen starts competing for your attention.
Automation can reduce the number of fresh decisions in a long-term portfolio. Both Robinhood and Webull support recurring investments and dividend reinvestment. The discipline comes from the rules and schedule, not the logo above the order ticket.
3. Check the real costs once
Before committing, review the current fee schedule, margin terms, routing disclosure, and transfer fee. Our guide to zero-commission broker hidden fees covers the costs that disappear from the headline. The brokerage account settings checklist turns that review into concrete choices.
Then stop shopping unless a real mismatch remains. A small fee or interface difference rarely matters as much as a large difference in the way you behave.
| Before placing an order | Pass | Warning sign |
|---|---|---|
| Reason | The purchase is allowed by a written plan. | The idea came from a mover list, alert, or social post. |
| Position size | The loss would not break the portfolio plan. | You are increasing size because the trade feels urgent. |
| Order type | You know why a market or limit order fits. | You are using the default without checking liquidity. |
| Funding | The trade uses available cash as planned. | Margin is filling a gap you did not plan to borrow. |
| After the order | You can close the app until the next review. | You expect to watch every price move. |
The final choice can be simple. Choose Webull when full paper trading or its platform layout serves a defined method. Choose Robinhood when its interface fits you and it supports the account, assets, and controls your plan needs. Walk away from either platform if its design keeps pulling you away from written rules.
FAQ
Are Robinhood and Webull safe for long-term investing?
Both can hold long-term stocks and ETFs through U.S. broker-dealer entities. SIPC protection has a narrow job: it can protect eligible cash and securities within applicable limits if a member brokerage fails and customer assets are missing. It does not reimburse market losses, bad investment choices, margin losses, or a falling stock price. Account security, diversification, permissions, and investor behavior remain separate risks that SIPC does not solve.
Which app is better for a complete beginner?
There is no automatic beginner winner because the better fit depends on what the beginner will actually use. Webull has the clearer edge when full paper trading matters, while Robinhood may feel easier to some users as a matter of personal interface preference. A beginner should favor the broker that supports the needed account and assets, keeps unwanted margin or options access off, and makes a low-frequency plan easy to follow.
Do Robinhood and Webull have hidden fees?
Both advertise $0 commissions on eligible U.S. stock and ETF trades, but other costs can apply. Depending on the product, those can include regulatory charges, margin interest, subscriptions, transfer fees, options-related charges, crypto pricing or spreads, and the bid-ask spread itself. Many of these costs are disclosed rather than literally hidden. Compare the current fee schedule for the products you will use.
Should I transfer out of Robinhood or Webull?
Transfer when the current broker lacks an account, asset, service, or control that your plan truly needs. As of this update, Robinhood lists a $100 outgoing transfer fee and Webull lists $75, but fees can change. Also check fractional-share handling, open positions, cost-basis records, tax effects, and service interruption. Moving because another app looks better can simply move the same habits to a new screen.
Keep reading: Build the rules before choosing the buttons with an investment policy statement. Then audit the cost side through zero-commission broker hidden fees and the brokerage account settings checklist.
Your turn
Which feature would actually change your process: paper trading, recurring purchases, a specific chart tool, or fewer alerts?
- Matched platform comparison: Robinhood and Webull issuer pages were checked on the same decision points: recurring investing, DRIP, charting, practice tools, stock and ETF commissions, outgoing transfer fees, routing disclosures, and SIPC scope. Features and fees are treated as an August 28, 2026 snapshot.
- SEC enforcement record: The $34.1 million figure comes from the SEC’s December 17, 2020 Robinhood order and covers certain orders from October 2016 through June 2019 after accounting for competing brokers’ commissions.
- Order-routing framework: SEC guidance and current Robinhood and Webull routing materials were used for the routing discussion. The materials checked for this update cover Q2 2026. The article does not treat the public reports as an execution-quality ranking.
- Behavioral evidence: Barber, Huang, Odean, and Schwarz, Attention-Induced Trading and Returns: Evidence from Robinhood Users, Journal of Finance 77(6), 2022. The sample ran from May 2018 through August 2020. The reported estimate is not applied to Webull users.
- Custody scope: SIPC guidance was used to separate brokerage-failure protection from protection against market losses.
Evidence mix: SEC records, broker pages and reports, SIPC guidance, and peer-reviewed finance research.
AI tools assisted with comparison organization and copyediting. Danny Hwang reviewed the platform documentation, regulator records, study scope, calculations, and final conclusions. See the editorial policy.
Update history
- v1.5 2026-08-28 TOOL + VISUAL
Replaced the generic comparison image with a decision-chart placeholder and converted the fixed turnover example into an interactive trading-friction scenario calculator while preserving the article’s broker-neutral execution-cost framing.
- v1.4 2026-08-28 FACT + READER FLOW
Refreshed both brokers’ routing evidence to Q2 2026, added current outgoing transfer fees, clarified Robinhood’s options-focused Simulated Returns versus Webull paper trading, tightened the comparison and order-flow sections, shortened repetitive FAQ answers, and aligned the TOC and FAQ markup with the current site runtime.
- v1.3 2026-07-29 FACT + COMPARISON
Rebuilt the feature matrix on matched criteria, added Webull recurring-investment and DRIP support, added Robinhood advanced-chart and indicator support, clarified the behavioral study’s dates and event definition, and updated the article-link format.
- v1.2 2026-07-12 FACT + STRUCTURE
Updated the routing evidence, corrected the turnover-model denominator, expanded the study limits, and refreshed the article-specific trust package.