
Macro & MarketsRead the Cycle Without Trading Every Headline
Macro data matters, but the first interpretation is often the least useful one.
We connect inflation, rates, currencies, growth, and market regimes to the portfolio decisions they can actually change.
Official Data
Historical Regimes
Portfolio Context
The Transmission Chain
How We Turn Macro Data Into Portfolio Context
Economic releases do not move every asset through the same channel or on the same timetable. We separate the indicator from the mechanism, then ask whether the result is large and durable enough to justify a portfolio decision.
01 · Indicator
What does the data actually measure?
We define the release, revision process, time window, and denominator before using it as evidence about the economy or markets.
02 · Transmission
How could it reach asset prices?
Rates, earnings, currencies, credit conditions, and valuation multiples are traced separately instead of treating one headline as a universal market cause.
03 · Portfolio
Is the effect actionable or merely interesting?
We compare the signal with diversification, implementation costs, and the risk of acting after the information is already reflected in prices.
Macro and market analysis for education and portfolio context, not a forecast or personalized allocation recommendation.
Research Library
Latest Macro & Markets Analysis
Inflation, interest rates, currencies, market cycles, global diversification, commodities, and economic indicators.
Jul 16, 2026
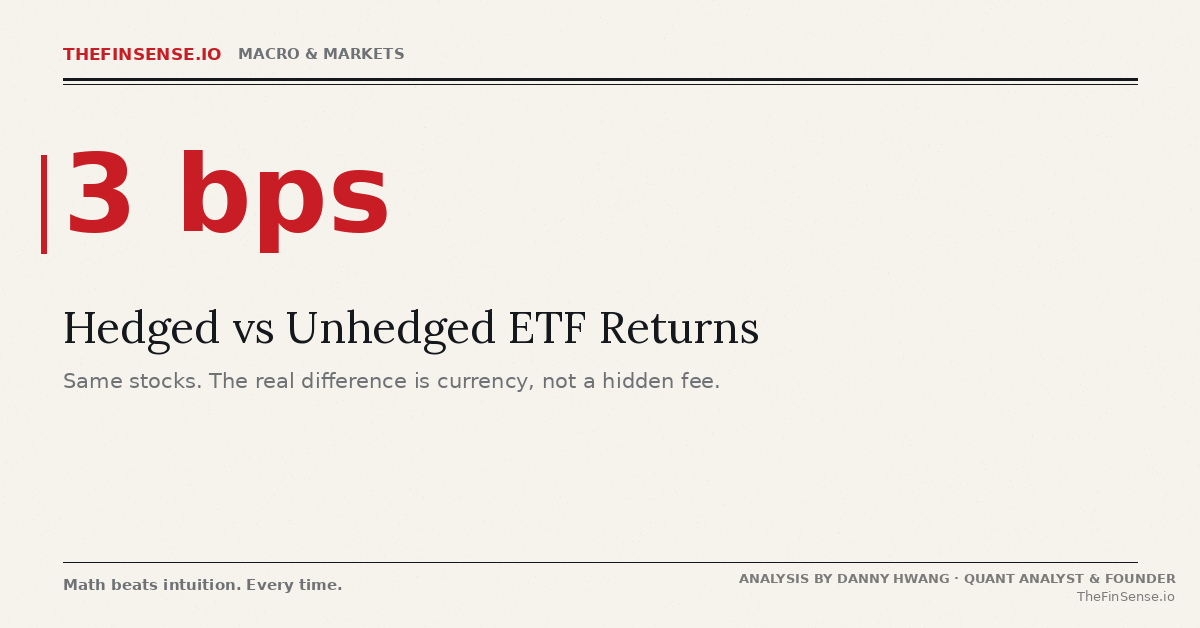
Hedged vs Unhedged ETF Returns: The Hidden 0.20% Cost
The hedged version of a fund and the plain version can hold the very same stocks, yet quietly cost you thousands apart.
Read the analysis →Jul 12, 2026
Why Emerging Markets Underperform: The 15-Year Gap
Emerging markets have lagged for fifteen years mostly because their booming economies issue a flood of new shares. Those IPOs hand economic growth to new investors before it reaches the…
Read the analysis →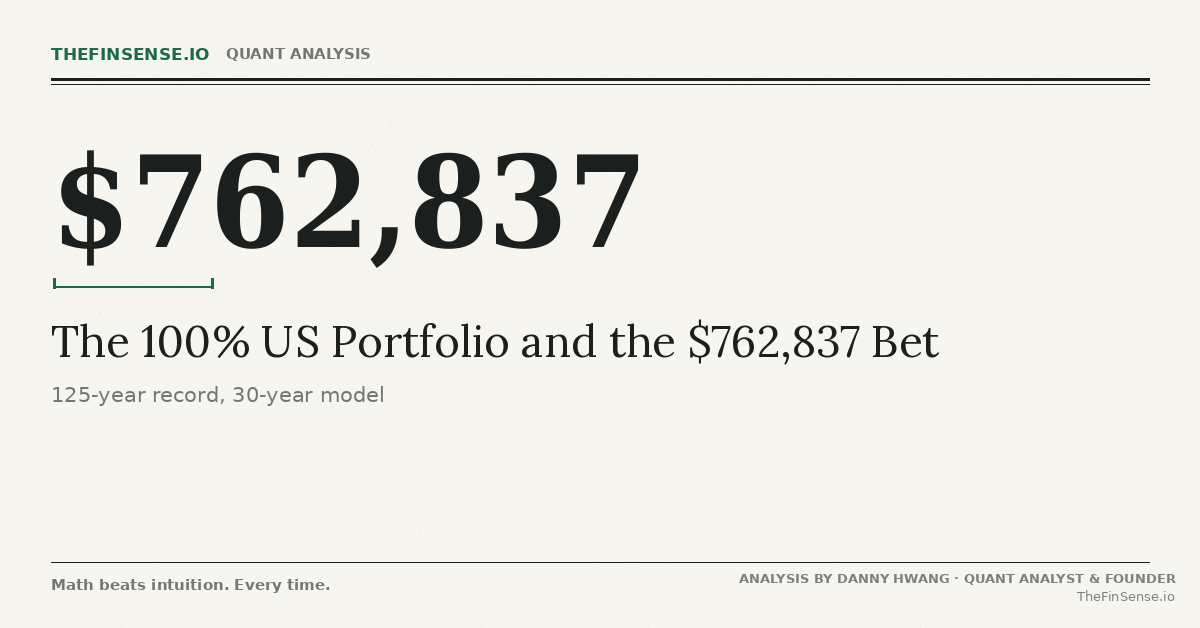
Jul 8, 2026
100% US Portfolio: Did 10 Countries Beat It?
A 100% US portfolio isn’t a safe default. It’s a geographically undiversified bet on one region, and which region wins flips with the decade you happen to start in. Published…
Read the analysis →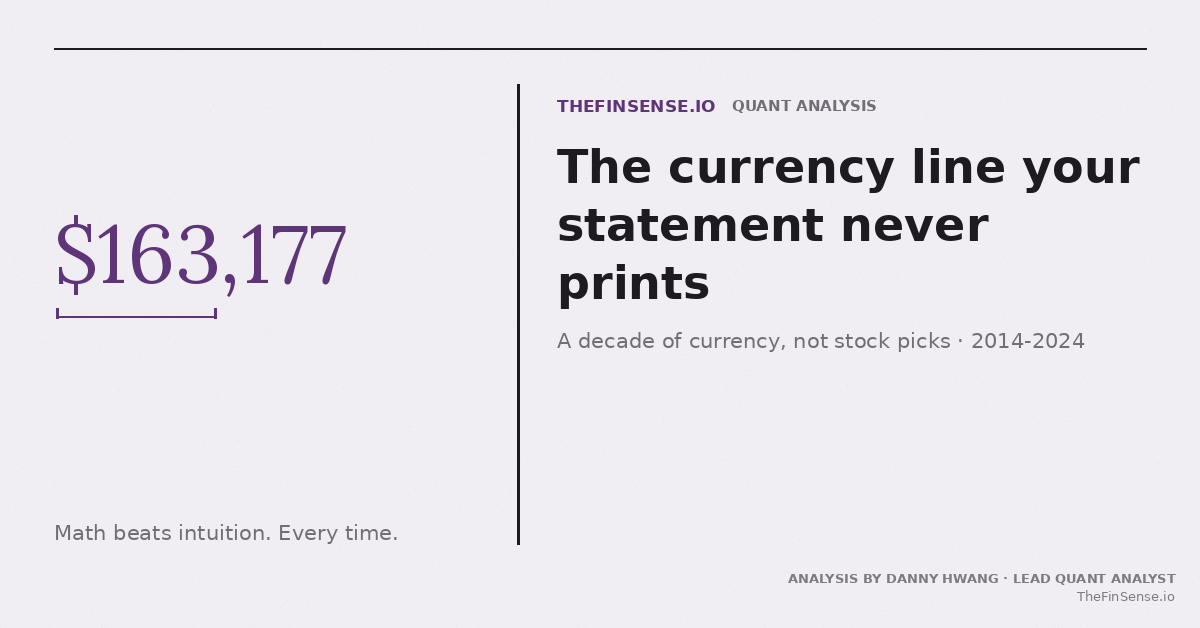
Jul 4, 2026
Strong Dollar and Your ETF: The 20% Effect
International funds lagged for a decade, and most investors blamed the funds. The real driver was the currency line no statement prints: on a modeled $300,000 portfolio, a strong dollar…
Read the analysis →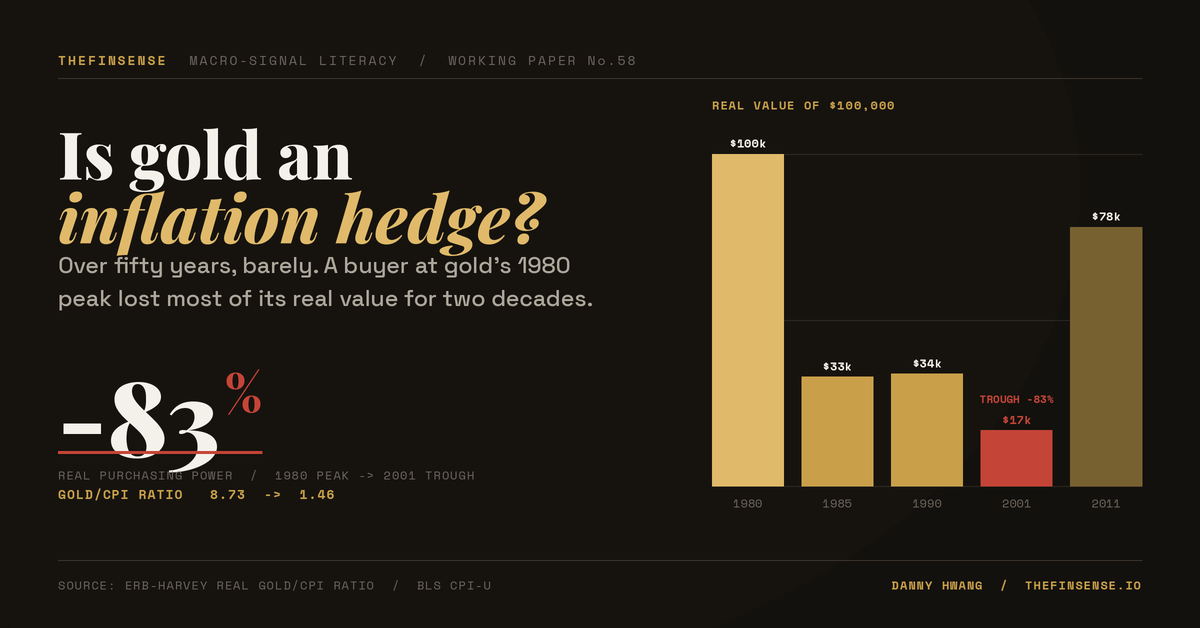
Jun 30, 2026
Is Gold Inflation Hedge? 83% Loss After 1980
Published: June 30, 2026 Last reviewed: June 2026 Educational analysis only. Not personalized financial advice. In 1980, even the heaviest bar in the vault began to lose its weight. −83%real…
Read the analysis →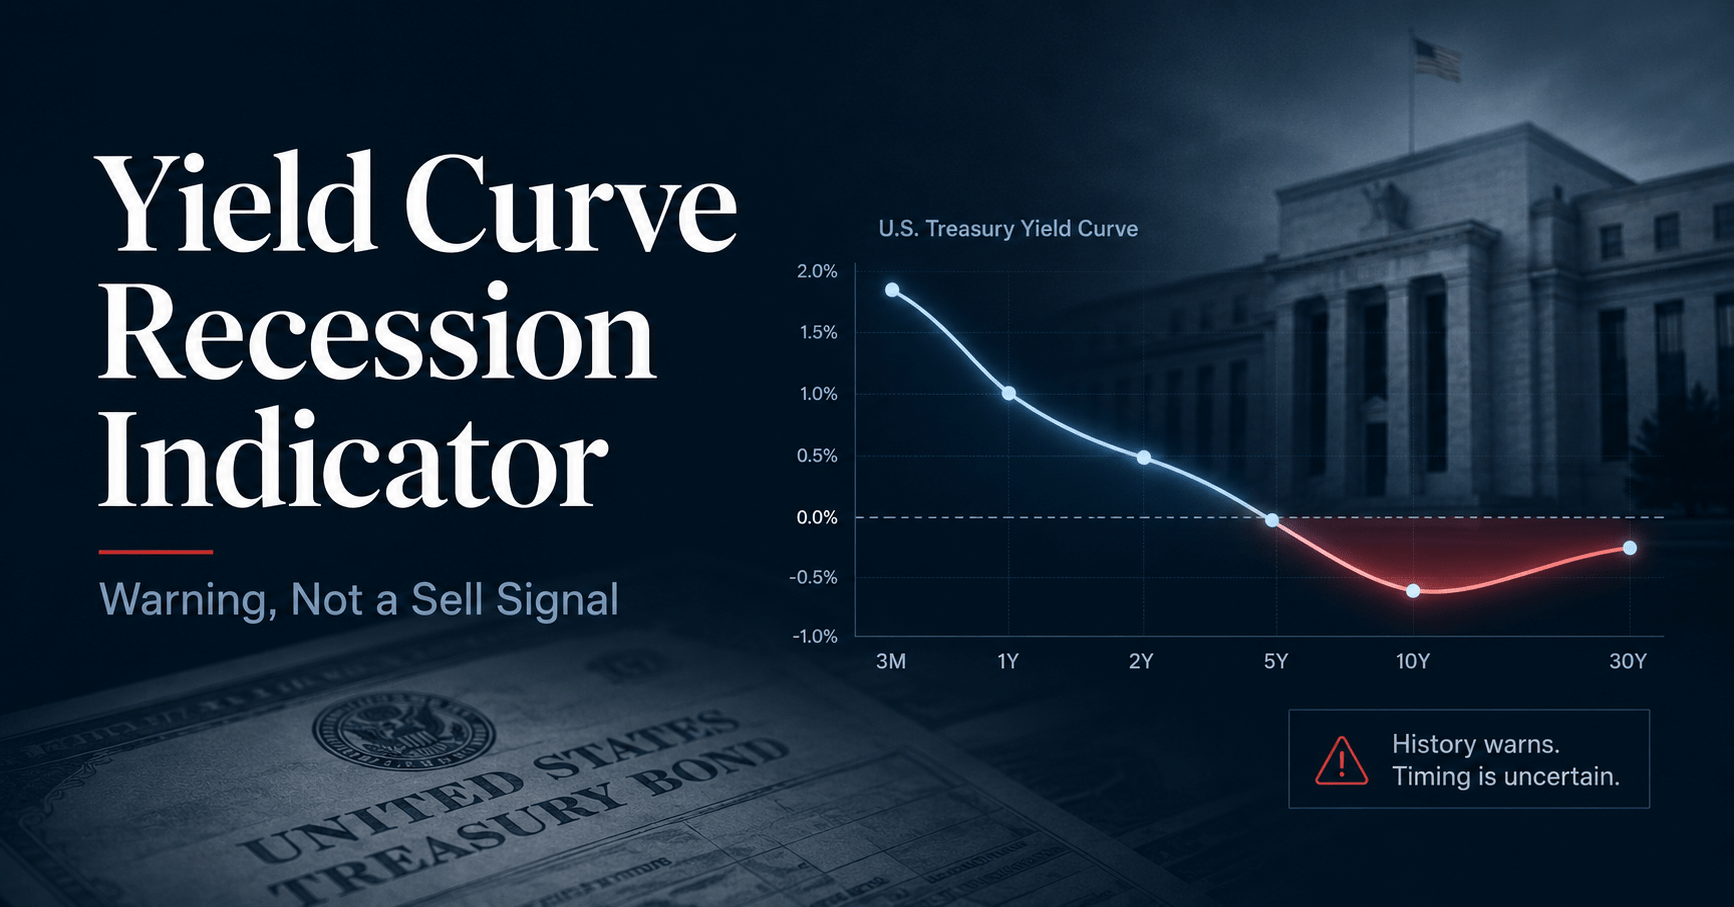
Jun 27, 2026
Yield Curve Recession Indicator: Warning, Not a Sell Signal
The yield curve recession indicator has flagged every US recession in sixty years, yet selling at inversion skipped a 28.8% rally.
Read the analysis →
Jun 22, 2026
Business Cycle Investing: Why Sector Rotation Is Hard to Trade
Even with perfect foresight, business cycle investing beat the market by at most 2.3% a year from 1948 to 2007, and real costs erase it. Here is what works.
Read the analysis →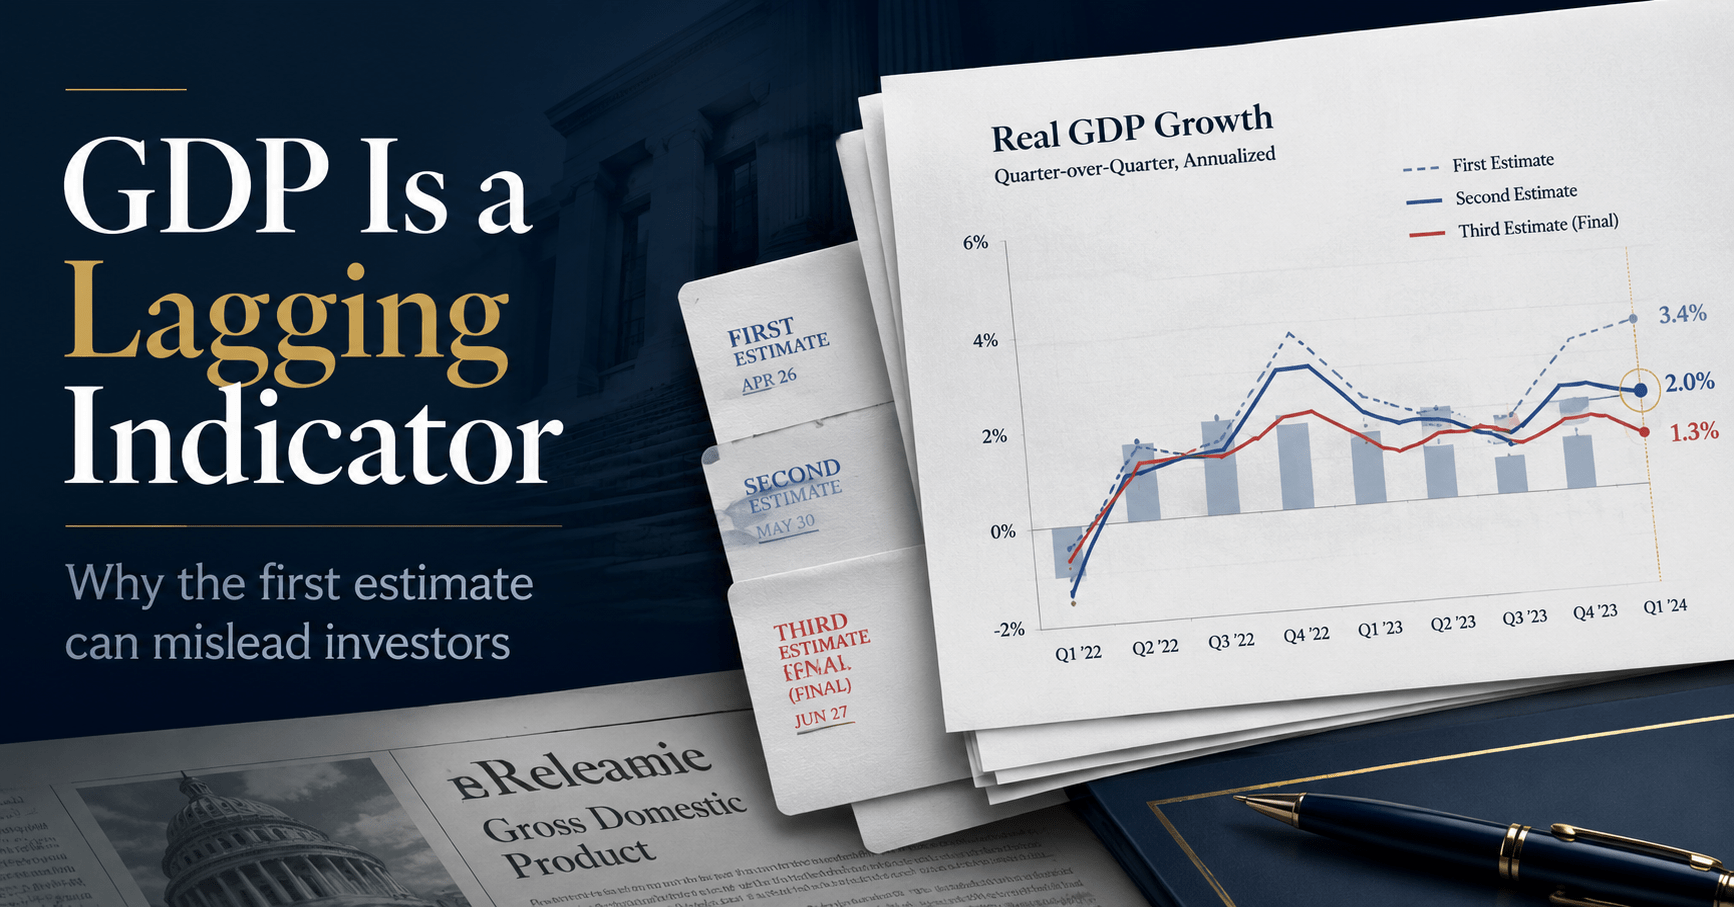
Jun 18, 2026
Why GDP Is a Lagging Indicator and Why the First Estimate Can Mislead Investors
GDP arrives after the quarter and changes as fuller data comes in. This guide compares official estimate vintages and gives investors a practical rule for deciding whether a headline warrants…
Read the analysis →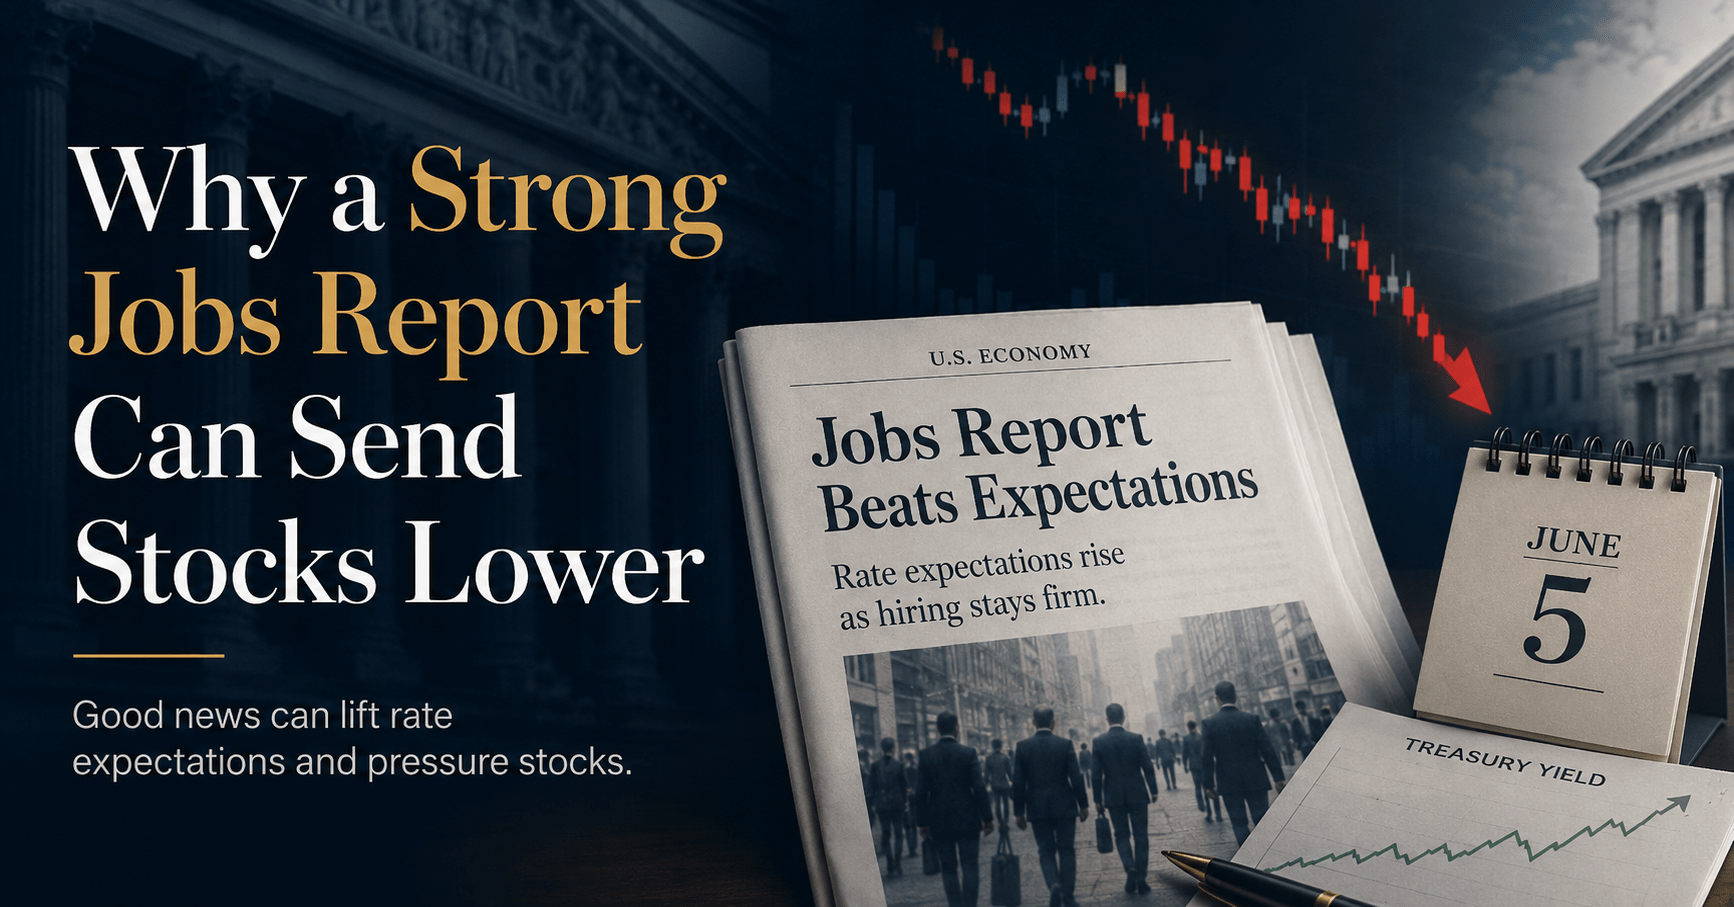
Jun 15, 2026
Why a Strong Jobs Report Can Send Stocks Lower
A strong jobs report can lift Treasury yields and pressure stocks, but one preliminary payroll estimate is not a clean trade signal. Here is how long-term investors should read the…
Read the analysis →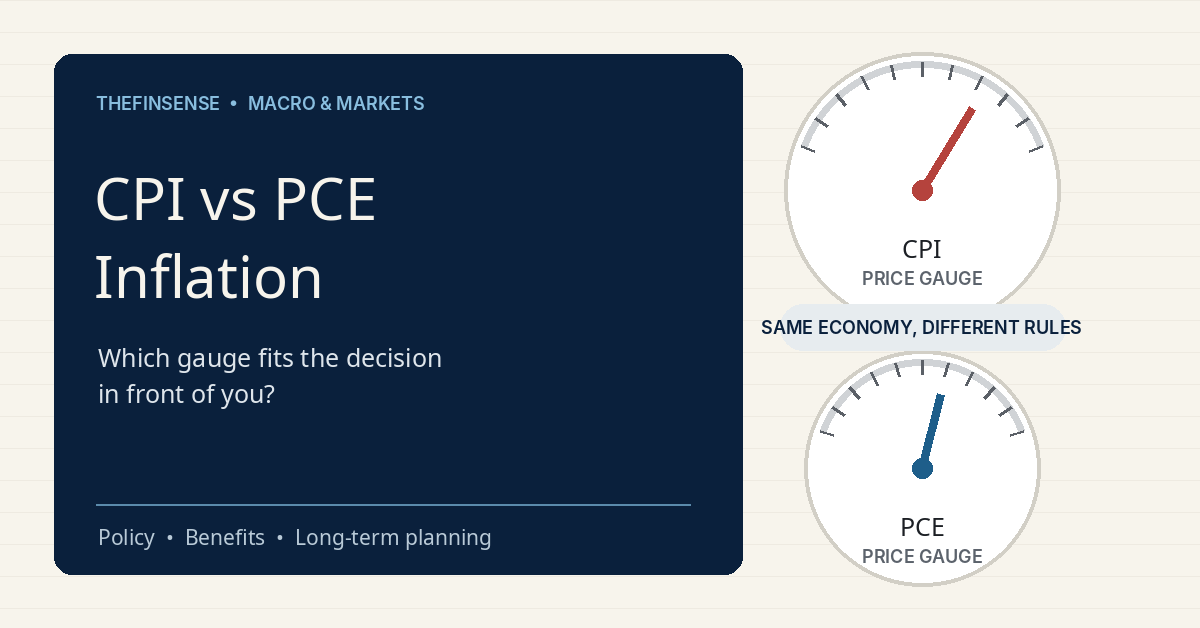
Jun 10, 2026
CPI vs PCE Inflation: Which Gauge Should You Use?
CPI vs PCE inflation reads like one story until you set the two gauges side by side. The CPI you hear has run about 0.4 point a year hotter than…
Read the analysis →