
📅 Originally Published: · Last Updated:
The Bottom Line, Up Front
Semiconductor ETF dollar cost averaging turns an unwinnable timing problem into a simple monthly habit. On the 18-year plan modeled below, three years of waiting cost $14,824 with the cash sitting idle, or $7,729 if that cash earns 4%, lost not to a crash but to time spent out of the fund.
What is semiconductor ETF dollar cost averaging?
Semiconductor ETF dollar cost averaging means buying a fixed dollar amount of a chip fund like SOXX or SMH on a schedule regardless of price. It exists because the chip sector runs a boom-bust cycle widely put at three to four years, whose turning points are hard to call.
Aubry and Renou-Maissant found that even sophisticated models failed to predict the direction of change in 78% of all cases. They report that beyond a one-month horizon none of the models could call direction.
Because a single fab costs roughly two billion dollars and takes years to build, supply arrives late and turns stay unpredictable. Averaging in monthly removes the need to guess the bottom and keeps you invested through the swings. The tradeoff is that averaging will not beat a perfectly timed lump sum.
Semiconductor ETF dollar cost averaging skips the impossible job of timing the chip cycle bottom. On one 18-year plan, three years spent waiting for a cleaner entry is the cost almost no one measures.
Most investors believe the chip cycle can be timed. The more useful question for anyone holding cash right now is what the search costs while it runs, because every month spent hunting for a cleaner entry is a month the money is not compounding.
Every sharp chip selloff brings back the same question of whether to wait for a cleaner entry, and the arithmetic answers it the same way. TheFinSense’s original calculation of a 36-month waiting scenario shows the timing tax in plain dollars.
Why can’t you just wait for the chip cycle to bottom?
Picture dropping your phone in a dark room. You know it landed close, so you run your hand across the floor, sure the next pass will find it. The chip cycle feels the same on the way down. Everyone sees the screen go dark, and everyone believes the bottom is one more sweep away.
Timing feels learnable because the chip cycle really is periodic. Booms and busts arrive on the three to four year beat the industry commonly cites. Analysts publish target bottoms, financial media count inventory weeks, and every past chart makes the last turn look obvious in hindsight.
The forecasting shops, tip sheets, and media desks that sell precise bottom calls profit whether or not the calls ever land. So the confidence you feel may be partly manufactured, sold by people paid to sound certain.
This extends the same arithmetic behind our other cost studies. A 100% US portfolio runs $762,837 over thirty years, the emerging markets drag runs $260,320, and here a three-year wait skims $14,824. Different default, one invisible ledger.
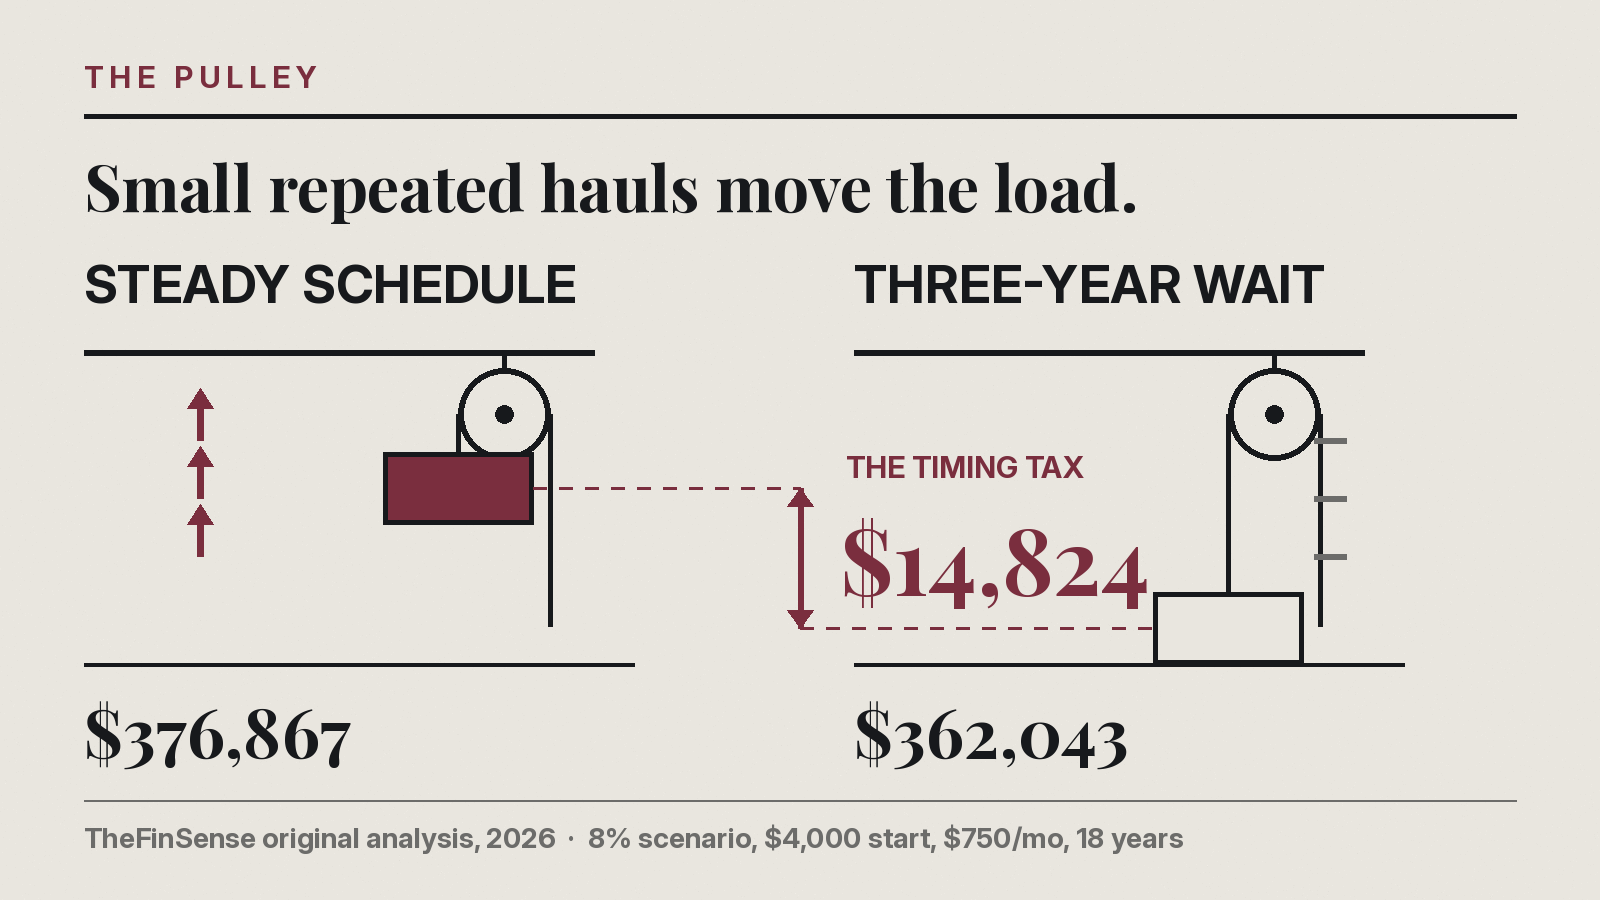
The reader hovering over the buy button, the one waiting in cash for a signal, and the one already averaging in all face one number. Waiting three years for a cleaner entry carries a five-figure cost on this plan, and none of the three can see the bottom any better.
📚 Source: The timing tax comes from an original 18-year delayed-start model · TheFinSense original analysis, 2026. Read the methodology.
Knowing which fund to average into helps too. The vehicle you choose could matter, so it is worth understanding how ETFs and mutual funds differ before you commit to a schedule.
Read this if: you invest in a diversified semiconductor ETF like SOXX or SMH with a time horizon of ten years or more.
Does not apply to: single chip stocks, leveraged funds like SOXL, or money you need within two years.
The slide is real and everyone can see it, so why can no one mark where it actually stops?
Can anyone actually time the semiconductor cycle?
If the fall is that easy to watch, the people paid to call its bottom should be catching these turns.
The people paid to forecast the chip cycle missed the direction in 78% of test cases, and they had models you do not.
Sources used in this article: two Tier 0 sources (a peer-reviewed Economic Modelling study and a 2024 NBER working paper), plus TheFinSense’s original 18-year timing-tax model. How source tiers work →
The evidence is blunt about how often the specialists get it right. In plain terms, the models carried no usable edge on which way the cycle would turn. Aubry and Renou-Maissant (2014) documented it directly: “in 78% of all cases, the null hypothesis of non-information value is accepted.”
📚 Source: Sophisticated models failed the direction test in nearly four of every five tested cases · Aubry and Renou-Maissant, Economic Modelling, 2014. Read the original.
One caveat belongs here. Those models forecast world semiconductor billings, the industry’s own shipment cycle, which is a different object from a fund’s price. A price already embeds the market’s collective guess about that same cycle, stacking a second unknown on top of the first. So the thing you are trying to time is the harder of the two.
The exception is narrow. A Markov switching model did call direction one month out, a window built for scheduling factory spending, not for starting an eighteen-year position.
A Markov switching model is one built to spot the moment a market flips from one state to another.
Whether you are frozen at the buy button, parked in cash, or already averaging in, the same arithmetic decides the outcome.
Why is the semiconductor cycle so hard to predict?
A fab gets committed to years before anyone knows whether the chips will be wanted. The forecasting problem starts there.
Why can’t analysts time the semiconductor cycle?
Even sophisticated econometric models failed the chip-cycle direction test in nearly four of every five tested cases. Aubry and Renou-Maissant documented that result in their 2014 Economic Modelling study. The models held far more data than any lone investor, yet still came up empty four times in five.
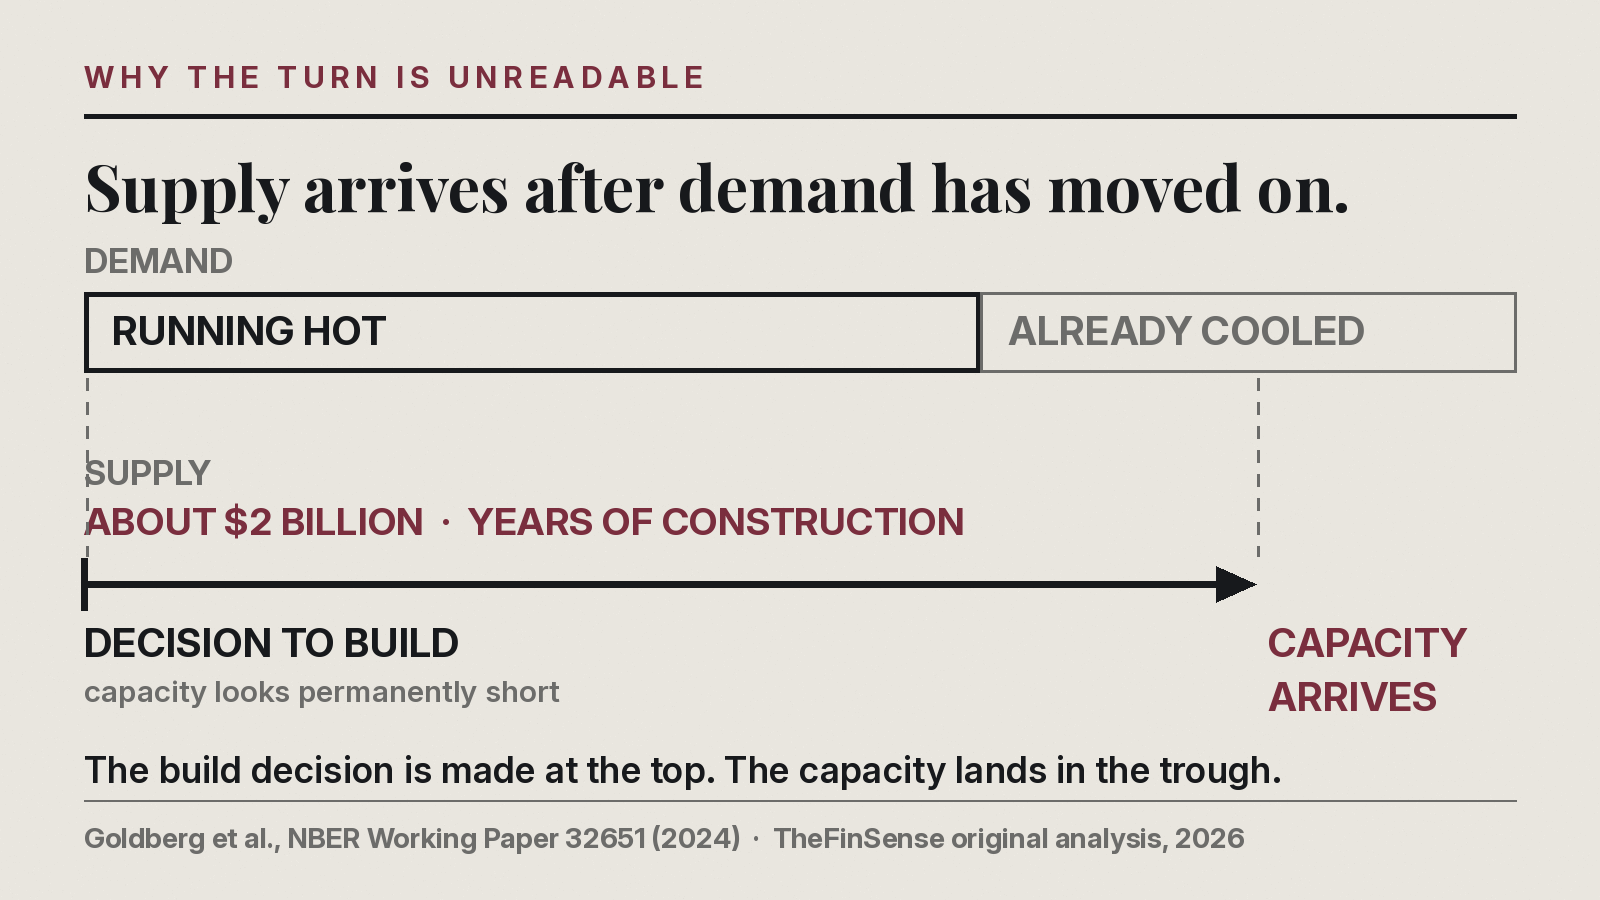
A single leading-edge fab costs about two billion dollars and takes years to finish, so capacity always lands on the wrong side of the cycle. Now the physical delay, not any lack of effort, is what keeps the turns out of reach. This same rhythm shows up in the broader business cycle, where lags between decisions and outcomes blur every timing signal.
How do fab lead times cause the boom-bust cycle?
A single leading-edge fabrication plant costs roughly two billion dollars and takes years to finish. The 2024 NBER paper by Goldberg and colleagues documents that figure. Because capacity arrives long after the build decision, supply routinely lands after demand has already moved on.
📚 Source: A leading-edge fab requires a large fixed investment of about two billion dollars · Goldberg and colleagues, NBER working paper w32651, 2024. Read the original.
Aubry and Renou-Maissant set out to find the best chip forecasting model, and they found one. Its turning-point value sits one month ahead, not at the horizon a long-term saver plans on.
The 2024 NBER working paper puts real numbers on the physics. A fab costs billions and takes years to build. The supply it finally adds was set in motion by a decision made earlier in the cycle.
Eighteen years of steady buying, undone in part by three years of waiting for a starting gun that never fires.
Formula: FV = P0*(1+r)^n + PMT*[((1+r)^n-1)/r], monthly r = annual/12
Model: delayed-start comparison of consistent monthly buying against a wait-then-invest path, valued at end of period.
Assumptions: 8% nominal return scenario, cash earning 0% during the wait in the base case, and no taxes or fees modeled.
Does not apply to: single stocks, leveraged ETFs, or horizons under two years.
Regulatory catalyst: none.
All financial metrics cross-validated against the peer-reviewed Economic Modelling study and the 2024 NBER working paper cited above, with every figure recomputed in Python. See Editorial Policy.
The common thread across both papers is simple. The cycle’s turning points come out of physical lead times, so they are something to live through, not a signal you can read in advance.
What a three-year wait cost one investor
The week the SOX slid 12%, Micah (a hypothetical investor) opened the app during lunch. They saw the recurring-investment toggle still off and chose to wait for the headlines to calm. Two weeks later they hovered over the buy button, then closed the app again to wait for confirmation.
Micah’s gap came from waiting, not from a crash. The same untimeable cycle now lands on their 18-year plan as a five-figure gap.
Micah is a hypothetical composite drawn from common early-career investor patterns. Not a real individual.
| Input | Value |
|---|---|
| Starting age | 33 |
| Starting balance | $4,000 |
| Monthly contribution | $750 |
| Horizon | 18 years, to age 51 |
| Return scenario | 8% nominal |
| Wait tested | 3 years, or 36 months |
Most readers guess that waiting two or three years for a clearer entry costs a few hundred dollars at most.
| Milestone | Steady schedule | Three-year wait | Gap |
|---|---|---|---|
| Year 5 | $61,067 | $55,809 | $5,258 |
| Year 10 | $146,088 | $138,255 | $7,833 |
| Year 15 | $272,756 | $261,086 | $11,670 |
| Year 18 | $376,867 | $362,043 | $14,824 |
Picture the same pulley from earlier. Micah stood beside the rope, waiting for it to go still before pulling, so the load stayed exactly where it was.
Micah waited three years for the bottom. The bottom never rang a bell. The delay cost $14,824. Same money. Same fund. Later start.
Put another way, $14,824 divided by the $750 monthly contribution equals roughly 20 months of buying, quietly handed to a pause. That is the timing tax.
The gap is not a market call. It is the price of a delayed start, and you can watch compound interest build the difference month by month. How much a single pause matters depends partly on your overall asset allocation strategy, since a chip ETF is one sleeve of a wider portfolio.
📚 Source: Steady-schedule and three-year-wait balances from an original 18-year delayed-start model on the 8% scenario · TheFinSense original analysis, 2026. Read the methodology.
If one three-year pause skims almost twenty months of savings, what would you honestly have done?
How do you dollar cost average into a semiconductor ETF?
A working plan never asks you to name the bottom. That is the entire design goal, and it is why the mechanics below are boring on purpose.
How do you start dollar cost averaging into a semiconductor ETF?
Setting a recurring monthly buy of a diversified semiconductor ETF like SOXX or SMH removes the timing decision entirely. Micah commits $750 on the same date each month regardless of headlines. The first fixed purchase matters more than the entry price.
Writing the rule down as a written investment policy statement makes it far harder to skip a buy when the sector is falling and every headline says to wait.
Numbers on a page are easy to nod at and easy to forget. The semiconductor ETF dollar cost averaging calculator below lets you drop in your own starting balance, monthly amount, horizon, and return scenario, then set how long a wait you are tempted to take. It reports the same timing tax the case study measured, in your own dollars, so the cost of pausing stops being abstract.
See what waiting for the bottom costs on your own numbers. Defaults use the 18-year plan modeled above.
| Year | Steady | Wait | Gap |
|---|---|---|---|
| Year 5 | $61,067 | $55,809 | $5,258 |
| Year 10 | $146,088 | $138,255 | $7,833 |
| Year 15 | $272,756 | $261,086 | $11,670 |
| Year 18 | $376,867 | $362,043 | $14,824 |
Run it once at the defaults and the gap lands on the same figure Micah gave up to a three-year pause. Push the wait longer and the number climbs fast. Shorten it and the tax shrinks but rarely disappears, because the cost comes from time out of the fund rather than the entry price you eventually catch.
How much does waiting for the bottom actually cost?
Waiting 12 months for a clearer entry costs Micah about $2,597 on this 18-year plan. Sitting out a full 60-month cycle more than doubles the gap to roughly $34,023. The delay never recovers, because the earliest dollars miss the most valuable years of compounding.
A 12-month wait looks harmless at $2,597, until you notice it is the same reflex that costs $34,023 across a full cycle.
What if you can’t stomach buying during a drawdown?
Splitting the cash into fixed weekly buys is the honest fix for an investor who cannot stomach buying into a slide. Micah keeps each purchase small and mechanical instead of gambling on one entry. A hesitant buyer still stays invested, which is the whole point.
When should you pause dollar cost averaging?
Pausing dollar cost averaging makes sense only for a rare investor with a fixed near-term deadline. Such a person must de-risk on a set date no matter the price. Aubry and Renou-Maissant’s miss rate shows almost nobody can pause and win, though averaging in during a long slide does lock in real losses that a patient buyer waiting in cash would have dodged.
Sensitivity table: 11 scenarios
Each row changes one assumption and holds the rest; read down to find the case closest to your own plan and horizon.
| Scenario | What changed | With Strategy | Without Strategy | Gap |
|---|---|---|---|---|
| Base case | balance $4,000, monthly $750, horizon 18y, return 8%, wait 36mo | $376,867 | $362,043 | $14,824 |
| Shorter wait | wait 12mo | $376,867 | $374,270 | $2,597 |
| Two-year wait | wait 24mo | $376,867 | $369,198 | $7,669 |
| Four-year wait | wait 48mo | $376,867 | $353,156 | $23,711 |
| Full-cycle wait | wait 60mo | $376,867 | $342,844 | $34,023 |
| Lower return | return 5% | $271,722 | $265,992 | $5,730 |
| Higher return | return 11% | $534,160 | $501,225 | $32,935 |
| Smaller monthly | monthly $400 | $208,837 | $199,263 | $9,574 |
| Larger monthly | monthly $1,000 | $496,888 | $478,315 | $18,573 |
| Shorter horizon | horizon 10y | $146,088 | $138,255 | $7,833 |
| Longer horizon | horizon 25y | $742,630 | $716,727 | $25,903 |
| Cash earns 4% | wait 36mo, cash 4% during wait | $376,867 | $369,137 | $7,729 |
📚 Source: Every scenario recomputed from the same delayed-start formula and case-study inputs · TheFinSense original analysis, 2026. Read the methodology.
Parking in a 4% savings account while waiting still surrenders $7,729, because the cost was leaving the fund, not the interest. The same invisible-cost logic turns up elsewhere too, such as a strong dollar’s drag on international ETFs.
Setting one recurring $750 buy today skips the guessing and, on this scenario, keeps the money that waiting would cost.
Who should not dollar cost average into semiconductor ETFs?
Averaging into a diversified semiconductor ETF suits horizons of a decade or longer. It does not fit single chip stocks, leveraged funds like SOXL, or cash needed within two years. Micah’s 18-year window fits cleanly, but a short deadline changes the math.
Averaging loses to a lump sum only for the rare investor who can name the bottom in advance and act on it. At the extreme, a reader who never starts at all and holds the same $4,000 plus $750 a month in cash earning 4% for the entire 18 years finishes about $131,965 behind the steady schedule. That is the full-paralysis boundary, not a typical outcome. The real cost is never starting.
Timing helps only the rare investor with a fixed near-term deadline who must de-risk on a set date no matter the price.
Next time the chip sector drops, ask: am I investing on a schedule, or waiting for an all-clear that does not exist? We will revisit these figures when the next SOX drawdown of 20% or more prints.
Semiconductor ETF dollar cost averaging: common questions
How long is the semiconductor cycle?
The semiconductor cycle is widely put at three to four years from one peak to the next, driven by the long lag between deciding to build capacity and that capacity coming online. Because a leading-edge fabrication plant costs billions and takes years to finish, supply tends to arrive after demand has already shifted, which stretches the boom and deepens the bust. Individual cycles vary in length and severity, so treating three to four years as a precise clock rather than a rough rhythm invites the same timing mistakes this guide warns against. The cycle is real, but its exact turning points stay stubbornly hard to call in advance.
Did AI kill the semiconductor cycle?
There is no solid evidence that AI demand has repealed the semiconductor cycle. Strong demand can lengthen an upswing and make the current expansion feel permanent, yet the physical drivers of the cycle have not changed. Fabs still cost billions and still take years to build, so supply still arrives late and still overshoots once demand cools. Past technology booms, from personal computers to smartphones, also felt like they had broken the cycle right up until the next downturn arrived. Averaging in on a schedule protects you whether or not this cycle behaves differently, because it removes the need to bet on that question at all.
SMH vs SOXX: which is better for averaging?
For dollar cost averaging, SMH and SOXX are more alike than different, and the choice rarely decides whether averaging works. Both hold a basket of major chip companies, so both spread the single-stock timing risk that sinks concentrated bets. Unlike broad benchmarks such as the Dow, Nasdaq, and S&P 500, they track a narrow chip index, and they differ mainly in holdings concentration rather than in strategy. The table below compares the two on the traits that matter most for a monthly buyer. Pick the one whose cost and concentration you are comfortable holding for a decade, then commit to a fixed schedule.
| Ticker | Focus | Holdings tilt | Best for |
|---|---|---|---|
| SMH | Largest chip names | More concentrated, top-heavy | Buyers who want leaders |
| SOXX | Broad chip index | More evenly spread | Buyers who want a wider basket |
When is the best time to buy a semiconductor ETF?
The best time to buy a semiconductor ETF is a recurring date you will actually keep, not a forecasted bottom. Because forecasting models have no track record of calling these turns reliably, a calendar you follow beats a signal you wait for. Set an automatic monthly purchase and let it run through the swings, since the earliest dollars compound for the longest. Waiting for a cleaner entry usually costs more than it saves, as the case study in this guide lays out in plain dollars. The right day to start is simply the next one your own schedule happens to land on.
Averaging vs lump sum for cyclical sectors?
Across cyclical sectors, a perfectly timed lump sum beats averaging every time, and almost no one hits that timing. The reason is arithmetic rather than opinion. Averaging spreads purchases so that no single entry decides your outcome, which is exactly what you want when turning points are unpredictable. A lump sum wins only if you buy near a true bottom, and the research in this guide shows even specialists with far more data could not call those turning points with any reliability. For a diversified fund like SOXX or SMH held a decade or more, averaging is the practical default. If you hold a large cash balance you want invested, splitting it into fixed weekly buys captures the discipline without one high-stakes guess.
The bottom line on semiconductor ETF dollar cost averaging
Eighteen years of steady buying built the balance, and a three-year wait quietly took part of it back.
The mechanism is simple once you see it. The 2014 study showed that even sophisticated models failed the direction test in most of the cases they ran, so the bottom you keep waiting for is not a signal anyone can reliably read. Semiconductor ETF dollar cost averaging sidesteps the whole problem by refusing to guess, and the case study above shows exactly what the guessing costs.
The waiting habit is not one delay but a reflex that repeats every cycle.
Open your brokerage today. Set a fixed monthly buy. If you see ‘wait for confirmation,’ ignore it.
The cycle is real and its turning points stay unreadable, so the schedule is the only part of this you actually control.
Eighteen years of showing up built $376,867. Three years of waiting shaved nearly twenty months of contributions off it. That is the whole arithmetic of the timing tax, and none of it required a correct forecast.
You are the investor who kept the buy on the calendar through every drawdown, all eighteen years of them.
The same compounding that opened this gap can be watched grow month by month.
Next reads: see how the 100% US cost study runs a similar hidden tab, watch the same compound interest build the gap month by month, or read why emerging markets underperform.
At 51, Micah owns the whole ride, not just the part after the all-clear.
Steady hauls move the load. Waiting for stillness never does.
YOUR TURN
When the chip sector drops next, will you buy on schedule or wait for a signal that does not arrive?
How this was made. A human analyst designed the model, verified every figure in Python, and wrote the analysis. AI tools assisted with drafting and formatting. All financial figures were checked against the cited academic sources before publication.
Review ledger: published July 19, 2026. Figures modeled in Python and cross-checked against the cited sources. Corrections are logged with timestamps. See Editorial Policy.
Update History
- 2026-07-19: Published.