
Originally Published: · Last Reviewed:
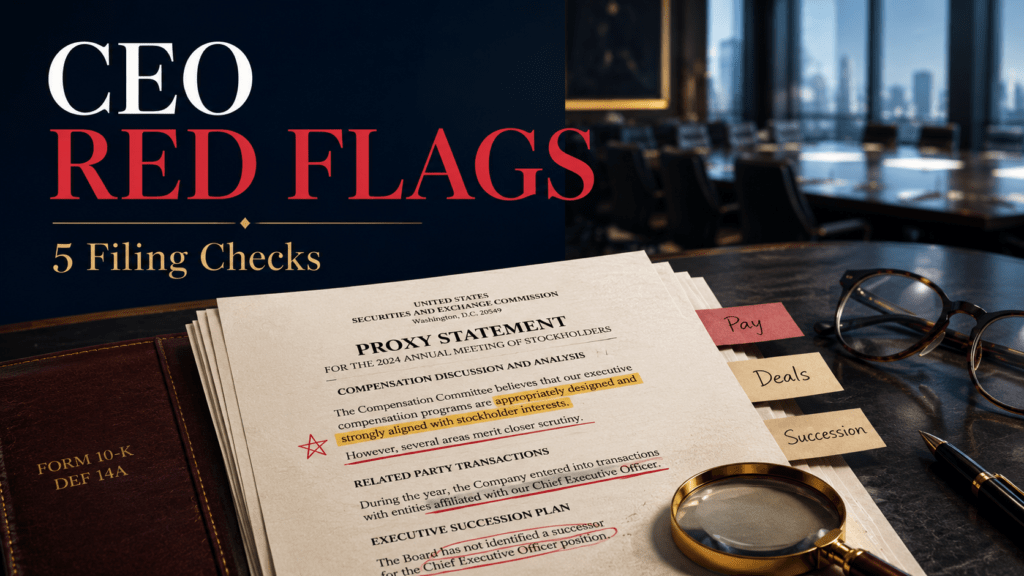
CEO red flags are patterns that justify more diligence, not a mechanical sell signal. Start with five places where a CEO and board leave a record: non-GAAP adjustments, pay versus performance, deal history, succession and board oversight, and gaps between filings and the investor story. One weak item may have a sound reason behind it in context. Repeated conflicts across several filings are a reason to pause.
A persuasive chief executive can be a major asset for a growing company. Confidence can recruit talent, keep a strategy intact through a bad quarter, and help fund a long project. The problem starts when confidence replaces evidence.
That distinction matters most when you own a concentrated position. A broad index spreads one CEO’s judgment across hundreds of companies, while a single stock does not. CEO red flags therefore deserve a repeatable filing review before you buy more, vote a proxy, or accept another deal story at face value.
Suppose a company reports strong adjusted profit, announces another large deal, and gives its CEO a large equity award. None of those facts proves a problem by itself. The useful question is whether the proxy, 10-K, 8-K, and later results tell the same story.
This guide avoids a numerical score on purpose. The research supports closer review of CEO incentives and deal behavior, but it does not validate a point system that predicts future returns. The goal is narrower: find conflicts that need a clear answer before your thesis depends on them.
What CEO red flags can and cannot tell you
CEO red flags can show where reported results, incentives, capital allocation, or board oversight need more work. They cannot tell you that a stock will fall, that high CEO pay is always excessive, or that one deal will destroy value. Use this framework as a research route, not a forecast.
One strong historical finding comes from deals announced from 1998 through 2001. Moeller, Schlingemann, and Stulz found that bidder shareholders lost 12 cents at announcement for every dollar spent, for a total loss of $240 billion. That result describes one merger-wave sample, not a fixed penalty for forceful leaders.
The same paper found that a small number of deals from extremely highly valued firms drove the total loss. Without those deals, bidder wealth would have increased. The finding raises the burden of proof for deal discipline when valuation is stretched, but it does not justify a blanket haircut for any one company.
Important boundary: those announcement returns show how the market repriced a specific set of deals. They are not a universal cost of CEO discretion, and investors should not compound the 12-cent figure as if every flagged company suffers the same lasting loss.
Malmendier and Tate studied 394 large U.S. firms from 1980 through 1994. CEOs they classified as overconfident had 65% higher odds of making a deal, and the market reaction to their deal news was more negative in that sample. The result supports tougher questions about price and deal discipline, not a personality-based trading rule.
Use these studies to raise the burden of proof, then use company filings to see whether the record meets it.
Five CEO red flags you can check in SEC filings
Useful CEO red flags come from conflicts in filings rather than labels such as “arrogant” or “visionary.” Each check below points to a document, a comparison, and a reason to dig further.
| Check | Where to look | What to compare | Reason to dig further |
|---|---|---|---|
| 1. Non-GAAP adjustments | Earnings release, 8-K exhibit, 10-Q and 10-K | GAAP result, adjusted result, reconciliation items and prior periods | The same “one-time” cost returns, labels change, or the bridge becomes harder to follow |
| 2. Pay versus performance | DEF 14A proxy, Item 402(v) table and pay discussion | Compensation actually paid, company TSR, peer TSR, net income and the company-selected measure | The board cannot link persistent pay growth to the measures it says drive pay |
| 3. Deal discipline | 8-K deal notice, merger documents, later 10-K and 10-Q filings | Original price and synergy claims against integration costs, impairments, sales and segment results | Targets move, promised benefits fade from later discussion, or repeated deals hide organic trends |
| 4. Succession and board oversight | DEF 14A, committee charters and 8-K Item 5.02 | Board independence, lead-director powers, succession process and the response to sudden departures | Board duties are vague, key power is concentrated, or a departure exposes a weak backup plan |
| 5. Narrative consistency | 10-K risk factors and MD&A, earnings calls, investor presentations | What leaders stress in public against what the filing calls material | Risks, dependencies or metric definitions appear in the filing but fade from the investor story |
1. Non-GAAP adjustments that never go away
Non-GAAP measures are not suspicious by default. They can help separate an operating trend from accounting items that make comparisons harder. The SEC requires a bridge to the closest GAAP measure and warns that unclear labels, custom accounting, recurring cash-cost exclusions, or undue prominence can make a non-GAAP measure misleading.
Read that bridge in two directions. First, ask what the company removed from this period’s GAAP result. Then compare the same categories across several filings and look for changes in labels, logic, or frequency. A large gap alone tells you very little.
A restructuring charge may be unusual once, but a program that returns year after year belongs in your view of the business. Stock-based pay is non-cash in the current period, yet it can dilute owners. Deal costs may be removed from adjusted earnings, while a serial buyer can make those costs part of its normal model.
No sound rule says that a 5%, 10%, or other fixed gap proves manipulation. Focus on what was removed, how often it returns, and whether the filing explains the change in a consistent way.
2. Pay that the board cannot explain
For covered firms, the SEC’s Pay Versus Performance rule puts compensation actually paid next to key performance measures in the proxy. Non-SRC firms generally show five fiscal years, while smaller reporting companies use scaled rules and a shorter table. Emerging growth companies, registered investment companies, and foreign private issuers are outside this rule.
The table is a starting point rather than a verdict. Compensation actually paid can swing because outstanding equity awards are remeasured, so a one-year jump may not equal cash handed to the CEO. Read the footnotes and the Compensation Discussion and Analysis before deciding what changed.
Concern rises when the board’s own story does not fit its evidence. If long-term value creation is said to drive pay, compare that claim with the chosen measures, vesting periods, peer group, and actual results. A large pay figure by itself says little.
3. Deal claims that disappear after closing
Deal notices are full of forecasts about synergies, cross-selling, margins, debt reduction, and strategic fit. The useful filing review starts after the initial deal story fades.
Save the original notice and record the price, funding, expected synergies, timing, and one-time costs. In later filings, search for the acquired business by name. Compare the early claims with segment results, goodwill and intangibles, restructuring costs, impairments, and the company’s account of organic growth.
The academic evidence gives this check weight without predicting the next deal. Moeller and coauthors found severe total bidder losses in one merger wave, while Malmendier and Tate linked their overconfidence measure with more deal activity. Both findings justify a clean bridge from the price paid to the results delivered.
For the cash side of that bridge, the cash flow statement analysis guide helps separate earnings language from cash used by deals, working capital, and integration.
4. Succession language without visible preparation
A company does not need to name its next CEO years in advance. The absence of a public name is not a red flag by itself. The more useful test is whether the board shows an active process and a credible response plan.
Look instead for signs that the board treats succession as active work. The proxy may describe board involvement, emergency plans, leadership development, and the committee that owns the process. Form 8-K Item 5.02 covers key director and officer departures, elections, and appointments, so compare the process described before a change with the board’s response when one occurs.
Dig further when one CEO holds unusual power, the board gives only generic oversight language, and a sudden departure reveals no credible interim plan. Key-person risk can affect valuation and position size even when the core business stays strong.
5. A story that is cleaner than the filing
Narrative consistency ties the other four checks together. A company may stress the strongest part of a quarter, while its filing must also cover material risks and dependencies. Your job is to notice when the investor story and the required filing describe meaningfully different businesses.
Search the 10-K for major customers, key channels, reimbursement, debt covenants, lawsuits, rule exposure, and important estimates. Then compare those passages with the earnings call and investor deck. A risk factor does not predict failure, but a material dependency that keeps disappearing from the public story deserves a direct question.
The fastest way to do this well is to read filings in a fixed order. The 10-K reading guide gives that sequence, while the economic moat framework helps test whether the strategic story is backed by durable economics.
How to route the result without pretending to predict the stock
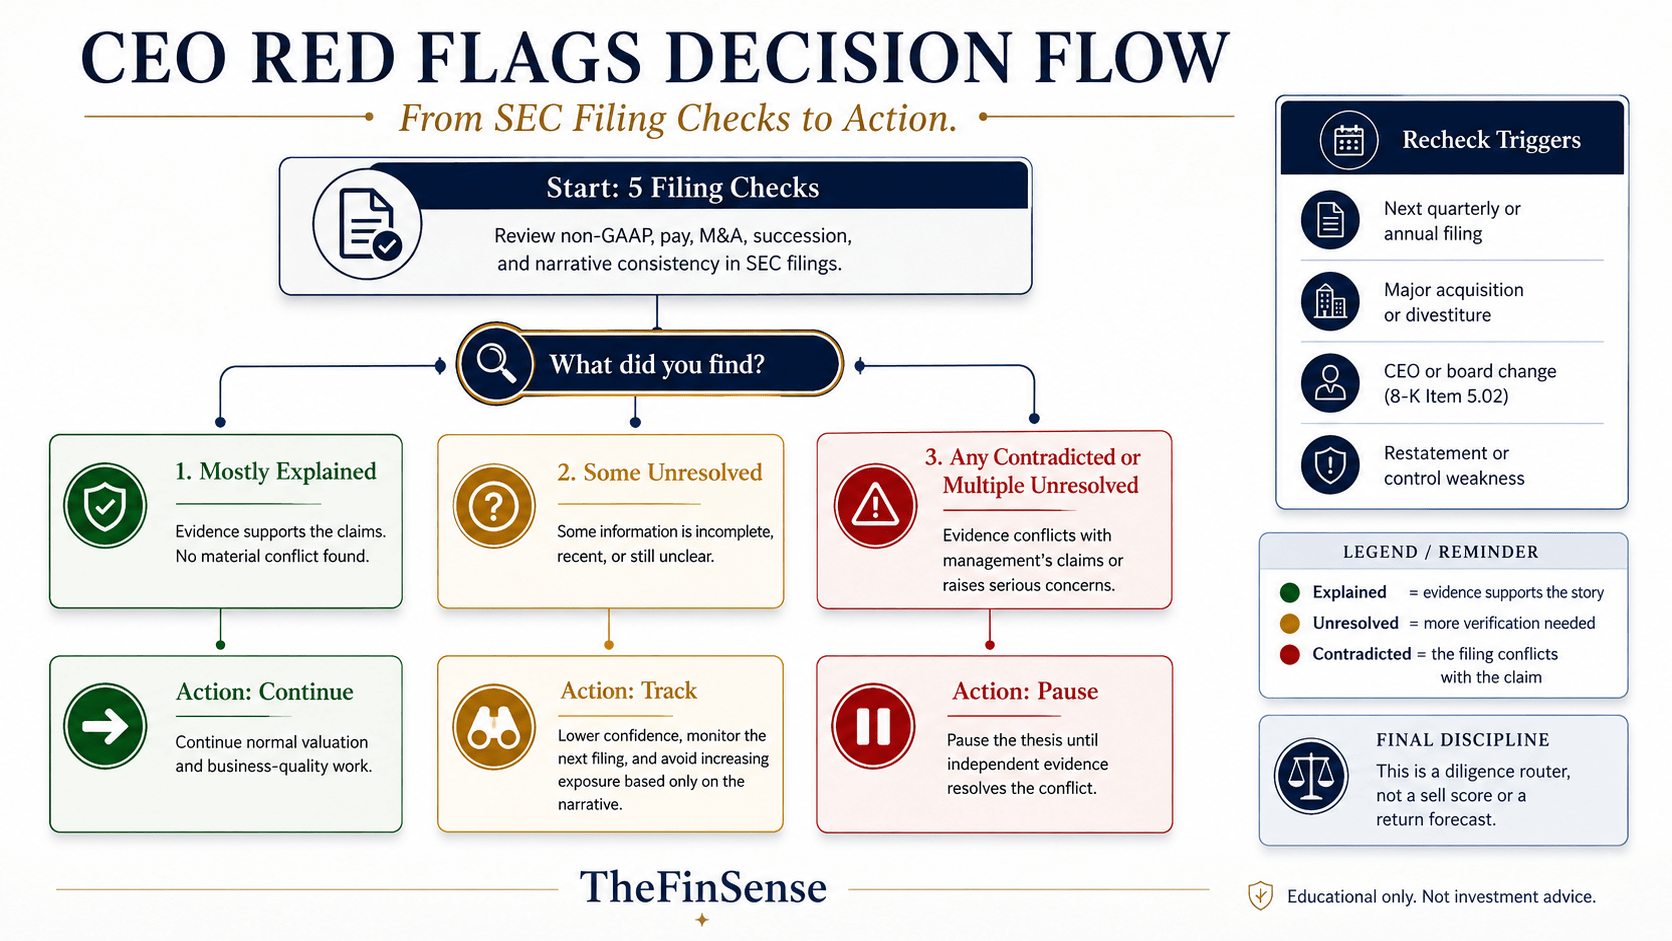
Do not add the five checks into a sell score. Sort each finding by the strength of the record: explained, unresolved, or contradicted. The next step is to keep normal diligence going, seek more evidence, or pause the thesis until the conflict is resolved.
| Result | What it means | Practical next step |
|---|---|---|
| Explained | The filing, footnotes and later results support the company’s account | Continue valuation and business-quality work without adding a governance penalty |
| Unresolved | The reason may be sound, but the record is incomplete, inconsistent, or too new to test | Lower confidence, track the next filing, and avoid adding solely because of the story |
| Contradicted | A company claim conflicts with a filing, repeated reconciliation, or delivered result | Pause the thesis and require outside evidence before relying on the disputed claim |
Free Fillable Worksheet
CEO Filing Review Worksheet
Record what management said, what the filing shows, and whether each finding is Explained, Unresolved, or Contradicted.
Fillable PDF · 3 pages
This approach avoids two common errors. One is treating every aggressive CEO as reckless, even though some founder-led and operator-led firms allocate capital well for decades. The other is giving a successful CEO permanent exemption from review. A strong record supports confidence in skill, but it does not make the next adjustment, pay plan, or deal self-validating.
When a finding remains open, reflect that doubt in choices you control. You may require a wider valuation margin, delay an addition, or keep the position smaller than you would with cleaner board evidence. Those are research and risk choices, not claims that a filing predicts the next price move.
Valeant and Philidor: what the filings later proved
Valeant is useful in hindsight because the SEC record shows several conflicts at once. A material business relationship was not fully described, Philidor affected reported growth and non-GAAP measures, and Valeant later restated part of 2014 revenue. The case shows why investors should cross-check channels and reconciliations, not that this five-check review could have predicted the full collapse.
In a 2020 SEC order involving former CEO J. Michael Pearson, the agency described Philidor as a key part of Valeant’s dermatology strategy. Valeant helped build Philidor’s infrastructure, kept a sales force that promoted access through the pharmacy, and paid some uncovered drug costs.
The order says Valeant’s public earnings materials did not fully disclose Philidor’s material effect on some GAAP and non-GAAP measures. It also says Valeant later cut previously reported 2014 revenue tied to Philidor by about $58 million and acknowledged material weaknesses in internal control over financial reporting.
This is where the five checks meet. The sales channel shaped the growth story, while the non-GAAP choices shaped how investors saw results. Disclosure choices affected how visible the relationship was, and later filings supplied facts that earlier public materials had not made equally clear.
What matters for an investor: when reported growth depends on a channel, customer, accounting adjustment, or deal that company leaders can shape, trace that dependency through the filing before treating the headline metric as durable.
Hindsight makes old warning signs look obvious after the outcome is known. Use Valeant to learn what a cross-document conflict looks like, not to claim that one phrase or metric can identify the next Valeant.
Frequently asked questions
What are the most important CEO red flags?
The most useful CEO red flags are repeated non-GAAP exclusions, pay the board cannot explain, deal claims that fade from later filings, weak signs of succession planning, and a public story that leaves out material dependencies found in the 10-K. None of these checks is an automatic sell signal on its own.
Is high CEO compensation a red flag?
Not by itself. Industry, company size, equity-award values, and performance periods all affect reported pay. Read the Pay Versus Performance table, its footnotes, and the Compensation Discussion and Analysis. The concern is a persistent mismatch that the board’s stated pay design cannot explain.
Which SEC filing should I read first?
Start with the DEF 14A proxy for CEO pay, board structure, and succession oversight. Use the 10-K for risks, MD&A, and material dependencies. Check 8-K filings for deals and leadership changes, then compare later 10-Q and 10-K filings with the original claims.
How many CEO red flags are too many?
No validated threshold turns a count into a buy or sell rule. One well-explained issue may matter less than one contradiction tied to a material source of revenue. Judge severity, recurrence, the company’s reason, and how much of your thesis depends on the disputed claim.
Can CEO red flags predict stock returns?
Not reliably from this checklist. The cited studies find links between CEO traits, deal behavior, and announcement returns in specific samples. This filing review is meant to improve diligence and expose weak assumptions, not to forecast stock returns.
CEO red flags: the bottom line
CEO red flags matter most before your thesis becomes attached to a leader. Read the non-GAAP bridge and proxy footnotes, save the original deal claims, and compare the investor story with the filing. Together, those steps test different parts of the same record before you classify each finding.
Classify each finding by what the record actually supports before you act. If the filing explains it, keep normal valuation work moving. If the record remains incomplete, lower your confidence and track the next filing. If a company claim conflicts with the filing or delivered result, pause the thesis until outside evidence closes the gap.
Your next filing check
Open the latest proxy for your largest individual-stock position. Which of the five checks raises a question that the company has not clearly answered?
- Moeller, Schlingemann and Stulz: the 1998-2001 deal-announcement result and the authors’ concentration qualifier. NBER working paper record.
- Malmendier and Tate (2008): the 394-firm, 1980-1994 sample, CEO-overconfidence classification, deal odds, and announcement-reaction evidence. Author-hosted paper.
- U.S. Securities and Exchange Commission: Item 402(v) Pay Versus Performance requirements, covered measures, exemptions, and scaled treatment. SEC compliance guide.
- U.S. Securities and Exchange Commission: current staff guidance on potentially misleading non-GAAP measures. Non-GAAP C&DIs.
- U.S. Securities and Exchange Commission: current Form 8-K, including Item 5.02 for key director and officer departures, elections, and appointments. Form 8-K.
- U.S. Securities and Exchange Commission: the order describing Valeant, Philidor, disclosure failures, and the later revenue restatement. SEC order.
Method: We checked the key factual and rule-based claims against the cited primary or author-hosted sources and kept each study’s sample, period, and limits in view. The framework stays qualitative because these sources do not validate a universal score, sell threshold, or long-run loss model.
Limits: This article does not reproduce a trading strategy or backtest. Filing duties vary by issuer type and history. A clean filing cannot guarantee good future returns, and a red flag does not prove misconduct.
AI tools assisted with source organization and consistency checks. Danny Hwang reviewed the cited documents, evidence boundaries, and final wording. This analysis is educational and does not provide individualized investment, tax, or legal advice.
Update history
-
v1.4
2026-08-21
ASSET UPDATEAdded a decision-flow visual and a fillable filing-review worksheet so readers can route findings as Explained, Unresolved, or Contradicted and track the next filing without turning the framework into a numerical sell score.
-
v1.3
2026-08-21
REVIEWRechecked the key research and SEC rules, added the Malmendier-Tate sample period, added current Form 8-K support for Item 5.02, simplified dense passages, updated canonical internal links, and aligned the trust package with the current site standard. The five-check thesis and decision route were preserved.
-
v1.2
2026-07-20
REVIEWMoved revision-focused language out of the reader-facing analysis and tightened the ending around the Explained, Unresolved, or Contradicted decision route.
-
v1.1
2026-07-19
MAJOR REVISIONRebuilt the article around filing checks, removed the unsupported compounding extrapolation and numerical red-flag score, corrected Pay Versus Performance scope, and added the acquisition-study concentration qualifier.
-
v1.0
2026-04-27
PUBLISHOriginal publication.
Educational quantitative analysis based on published data. Not investment, tax, or legal advice. Consult a licensed professional before acting on any calculation. About TheFinSense.