
A Fed Rate Decision Barely Moves Your Portfolio. Timing It Costs You.
22 minute read · long-form
The fed rate decision portfolio impact is mostly priced in: Bernanke and Kuttner found the S&P 500 reacts to the surprise, not the announced rate. Their event study put the typical move near 1% per unanticipated quarter-point cut. Because an expected cut is already in prices, selling before a meeting mainly forfeits time in the market. J.P. Morgan Asset Management shows the best days cluster near the worst, so stepping out risks missing the rebound.
The rail climbs hardest right after its worst dip, and ten days carry the ride.
📅 Originally Published: · Last Updated:
📋 Update History
- 2026-Q2: Initial publication. First TheFinSense piece tying the live April-2026 8-4 FOMC dissent to surprise-vs-level transmission.
- FOUNDATIONAL Bernanke and Kuttner (2005), Journal of Finance: the S&P 500 reacts to the surprise in a decision, about 1% per unanticipated quarter-point, not to the announced rate.
- SUPPORTING Swanson (2021), Journal of Monetary Economics: in the 2009 to 2015 near-zero-rate years, forward guidance and bond-buying moved asset prices about as much as rate changes did.
- CONFIRMATORY Nakamura and Steinsson (2018), Quarterly Journal of Economics: a policy surprise can also shift the growth outlook, so markets sometimes move opposite to the naive guess.
What this analysis adds
- It separates the announced rate from the surprise, the part markets actually price, and ties the move to the Bernanke-Kuttner anchor of about one percent per unanticipated quarter-point. mechanism decomposition
- It connects the rare April 2026 8-4 FOMC dissent, a fight over guidance language rather than the rate, to Swanson’s forward-guidance channel. live-event tie, absent from ranking competitors
- It pairs that surprise mechanism with the J.P. Morgan ten-best-days record to show why stepping out forfeits the rebound. data reframe
- It distills the choice into a three-gate check that answers “should I act?” without forecasting the meeting. decision tool
How this article was reviewed
Stage 1: Draft. AI-assisted draft built against a frozen evidence spine. 2026-06
Stage 2: Source verification. Four named-entity facts and a three-source academic spine (Bernanke-Kuttner 2005, Nakamura-Steinsson 2018, Swanson 2021) checked against primary sources; every forward-value figure computed in Python and cross-checked across an eleven-cell sensitivity grid; zero fabricated figures. 2026-06
Stage 3: Editorial. Danny Hwang reviewed the argument and re-verified every dollar and percentage against its primary source. 2026-06-05
Quick answer
The fed rate decision portfolio impact is mostly priced in: Bernanke and Kuttner found the S&P 500 reacts to the surprise, not the announced rate. Their event study put the typical move near 1% per unanticipated quarter-point cut.
Because an expected cut is already in prices, selling before a meeting mainly forfeits time in the market. J.P. Morgan Asset Management shows the best days cluster near the worst, so stepping out risks missing the rebound.
From 2005 to 2024, $10,000 left fully invested in the S&P 500 grew to $71,750, versus $32,871 if the ten best days were missed. So the real question is not what the Fed will do, but whether your plan needs changing at all.
The fed rate decision portfolio impact is mostly priced in, and markets react by about 1% only to the surprise. Missing the S&P 500’s ten best days over twenty years cut $71,750 down to $32,871. The danger is not the decision itself, but stepping off the rail just before the climb.
TheFinSense’s review of four Fed event studies and J.P. Morgan timing data shows the decision-day move is mostly priced before the gavel. The April 2026 FOMC hold, decided by a rare 8-4 vote, has investors again debating whether to move money before the next meeting.
This covers diversified long-term investors. It does not address leveraged traders, options positions, or money you need within a year.
How Does a Fed Rate Decision Affect Your Portfolio?
The belief that you should reposition before a Fed meeting is reasonable, because the decision dominates financial headlines for days. Brokerage alerts, cable segments, and prediction-market odds all frame the meeting as a moment that demands action. But the same coverage rarely mentions that the move is mostly priced in before the gavel falls.
The reasonable instinct to act on a Fed meeting is best satisfied by checking your plan, not by timing the market.
Call this the pre-meeting reflex: the urge to do something before the Federal Reserve speaks. It feels like control. The thing is, the reflex rests on a shaky assumption.
The question is not what the Federal Reserve will decide, but how much of that decision the market already prices.
Most coverage skips the part that matters: a fed rate decision is not a lever wired straight to your account. The Federal Reserve sets the federal funds rate, but your stocks move when traders are surprised, and most of what the Fed does is expected long before the meeting. The decision feels larger than it is because the rate grabs the headline while the surprise does the work.
The April 2026 meeting shows it plainly. The Federal Reserve held its target range at 3.50 to 3.75 percent, and the market barely flinched, because a hold was already expected.
📚 Source: Federal Reserve FOMC, 2026 · federalreserve.gov
Whether you are tempted to sell before the gavel, rattled into watching every dot plot, or already rebalancing on a schedule, the same record applies: the move is mostly priced, and the rebound clusters near the drop.
The pattern holds across all three habits. The Federal Reserve does not move your portfolio directly; the market does, and mostly on what it did not expect. The rate is the headline. The surprise is the story.
If the Fed is not the lever, then what actually moves the number on your screen?
How Much Does a Fed Rate Decision Actually Move the Market?
If the Fed does not move your portfolio directly, the next question is how much the market itself shifts when the gavel finally falls.
Most of a Fed rate decision is known before the meeting, because markets price in the expected move during the weeks beforehand. Bernanke and Kuttner studied decades of FOMC announcements and found that the S&P 500 reacts mainly to the surprise, the part of the decision the market did not anticipate. Their estimate put the typical reaction near 1% for every unanticipated quarter-point cut. So when the gavel falls on a widely expected move, the same-day price change is usually small, not the dramatic swing the headlines imply.
📚 Source: Bernanke & Kuttner (2005) · doi.org
Over roughly 5,000 trading days in twenty years, the ten best ones carried most of the S&P 500’s total return.
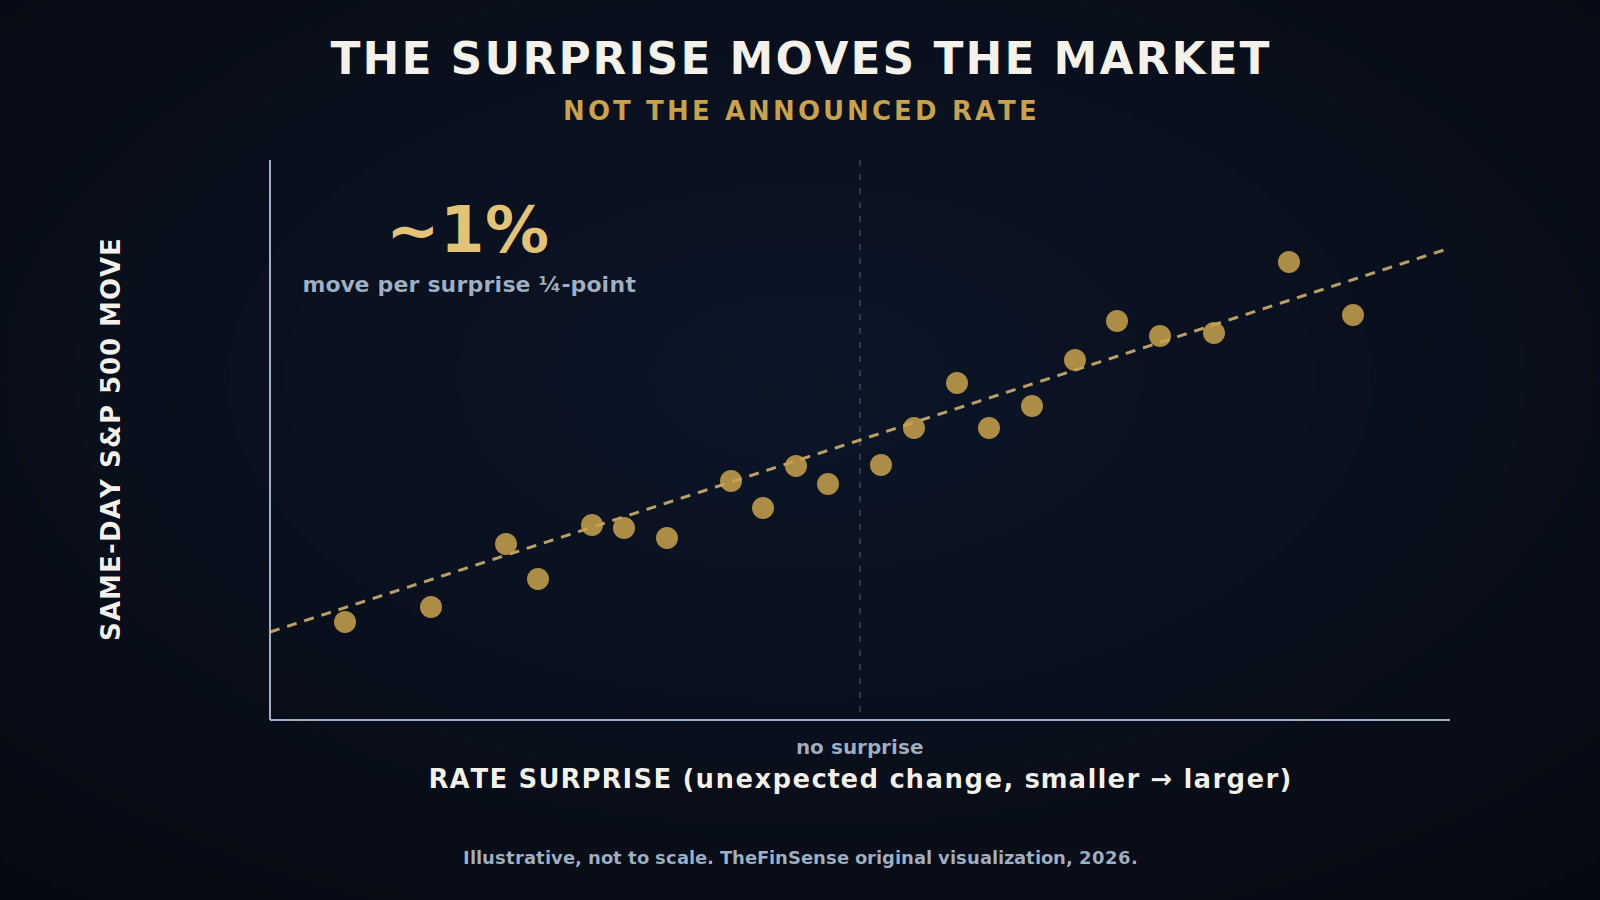
The rate level is mostly known in advance, so it is the surprise, near 1% per unexpected quarter-point, that moves prices. This is where the pre-meeting reflex misfires: it braces for the announced number, while the real action is the small, unforecastable gap between what was expected and what arrived.
For you, that means the entire twenty-year payoff hides inside about ten days you cannot circle on a calendar ahead of time. Stay fully invested and you keep them without trying. Step out around a meeting and you are timing the market, betting you can dodge the bad days without missing the good ones sitting right beside them.
The plan that protects all three is the one written before the meeting, not during it.
If the surprise is the whole move, which piece of the announcement are markets actually reading?
Why Does the Surprise Matter More Than the Rate Itself?
A same-day move near one percent still leaves a puzzle worth opening: which part of the announcement are markets actually reading?
The market’s response to a Fed meeting breaks into separate pieces, and the announced rate is only one of them. Analysts read the rate surprise first, then the forward guidance about future policy, then the signal the Fed sends about the economy. Eric Swanson found that during the near-zero-rate years of 2009 to 2015, guidance and bond-buying programs moved asset prices about as much as rate changes did, though that estimate belongs to that specific period. For a long-term investor, the lesson is that no single announced number explains the move on the screen.
Which Part of a Fed Decision Moves Stocks?
The surprise does the work. When the decision matches what the market already expected, prices barely budge, because the expectation was baked in days earlier. Only the gap between forecast and outcome is new information, and new information is what prices move on.
A Fed rate decision moves markets mainly through its surprise, not the announced level. Bernanke and Kuttner found the S&P 500 reacts to the part of a decision investors did not anticipate, near 1% per unanticipated quarter-point cut. An expected move is already reflected in prices before the gavel falls.
Does Forward Guidance Affect Markets?
Forward guidance can matter more than the rate. It is the language the Fed uses to hint at where policy goes next, and traders price that language the moment it lands. A single phrase about future cuts can move markets more than the number printed on the day.
Beyond the rate itself, markets read the Fed’s forward guidance about future policy. Eric Swanson estimated that during the 2009 to 2015 near-zero-rate period, guidance and bond-buying moved asset prices about as much as rate changes did, though that finding belongs to that specific low-rate era.
As event-study methods improved, the field moved from reading the rate level to reading the surprise and the guidance.
Before the work of Bernanke and Kuttner (2005), whose lead author Ben Bernanke would chair the Federal Reserve the following year, much commentary treated every rate change as a direct lever on stock prices. Their event study showed the market reacts to the unexpected part of a decision, not the announced level. Today analysts read the surprise component first, then the guidance, then the rate itself.
In our own balance-sheet research at TheFinSense, we built a three-regime classification of S&P 500 non-financial firms for exactly this reason: a rate surprise does not land on every holding equally. Cash-rich, low-leverage companies absorb a higher-rate path more easily than thinly capitalized ones that must refinance into it, so the same surprise can lift one corner of the index while pressing another. For a diversified investor those effects largely net out, which is one more reason the index-level reaction stays near that 1% surprise estimate rather than the larger swing the headline implies.
📚 Source: Hwang / TheFinSense (2026), working paper · ssrn.com · zenodo.org
Why Did the Fed Vote Split 8-4?
The April 2026 meeting is the cleanest recent proof that guidance, not the rate, is the real battleground. The Fed held the rate, yet four members dissented, the first four-way split in decades. As CNBC reported, “The last time four FOMC members dissented was in October 1992.”
The split was about language. Three of the four, Hammack, Kashkari, and Logan, objected to the easing-bias wording rather than the rate, while Miran preferred a quarter-point cut. They were fighting over the guidance, not the number.
📚 Source: CNBC / Federal Reserve, 2026 · cnbc.com
The April 2026 FOMC held rates at 3.50 to 3.75 percent in an 8-4 vote, the first with four dissents since 1992. Three dissenters objected to the easing-bias language, not the rate, which shows that guidance, not the announced number, is often the real battleground.
This all traces back to one foundational study. Bernanke and Kuttner (2005) were the first to separate the surprise from the announced rate cleanly, and their roughly one percent per unanticipated quarter-point remains the anchor every later study builds on.
Later work extended the idea to the language itself. During the years when rates sat near zero, the Fed leaned on bond-buying programs, known as large-scale asset purchases, or LSAPs, and on guidance, and Eric Swanson measured how much those tools moved markets.
Forward guidance and LSAPs had substantial and highly statistically significant effects.
Eric T. Swanson, UC Irvine, on Fed tools during the 2009 to 2015 near-zero-rate years
Those forward-guidance estimates come from the 2009 to 2015 near-zero-rate period and may not match today’s environment, so treat them as a ceiling rather than a current reading.
📚 Source: Swanson (2021) · doi.org
Put the same J.P. Morgan record in return terms and the stakes get concrete. Skipping ten days out of 5,000 sounds trivial, yet those ten days reframed a 10.4% return into 6.1%. Twenty years of patience built the balance; ten missed days erased most of it.
FV = 200000*(1+0.07/12)^(12t) + 500*(((1+0.07/12)^(12t)-1)/(0.07/12))
Model: monthly compounding, end-of-period contributions
Assumptions: 7% flat annual (planning convention), $200,000 initial, $500/mo, 20yr
Does not apply to: no historical S&P backtest; the persona path is a forward-value illustration, not a return claim
Regulatory catalyst: FOMC April 28-29 2026 hold (3.50-3.75%, 8-4 vote)
Source mix: three peer-reviewed papers (Bernanke-Kuttner 2005, Nakamura-Steinsson 2018, Swanson 2021), one government primary source (the April 2026 FOMC minutes), and one industry record (J.P. Morgan Asset Management via CNBC). Tier 0 and Tier 1 sources only; no commodity explainers are cited as support.
The common thread across Bernanke and Kuttner and Swanson is that markets react to what they did not expect, in the rate or in the guidance about what comes next.
Decompose the reaction and the announced number matters less than the guidance and the unexpected part. The headline rate is the easy thing to watch. It is also the least important.
If the announced number is the least of it, what does trying to time the announcement actually cost?
Case Study: What Timing the Fed Cost a $10,000 Stake
Noa traces $10,000 to either $71,750 or $32,871 over two decades.
Picture a long-term investor tempted to sell ahead of an FOMC decision to dodge the volatility. J.P. Morgan Asset Management illustrates the risk with one record: a $10,000 stake left fully invested in the S&P 500 from 2005 to 2024 grew to $71,750, while the same stake missing only the ten best trading days ended at $32,871. Those best days tend to cluster within about two weeks of the worst ones, so stepping out to avoid a meeting can mean sitting out the rebound. The cost is rarely the decision itself; it is the recovery missed while in cash.
📚 Source: J.P. Morgan Asset Management, 2025 · cnbc.com
The surprise-versus-level mechanism explains why the gavel rarely moves much. For Noa, the cost is not the meeting but the rebound days missed while sitting in cash.
On the morning of the June 2026 FOMC decision, Noa opens the order ticket, finger hovering over the Sell button.
Retail investors reach the same conclusion on their own. In long-running Bogleheads discussions, the recurring point about a widely expected cut is that the market has already priced it in.
Noa is a hypothetical composite drawn from common long-term-investor patterns, not a real individual.
Where this case study could mislead, and how it is guarded
- Reading Noa’s inputs as a recommendation. They are one illustration, guarded by the hypothetical-composite label and the forward-value framing.
- Blending two different numbers. The J.P. Morgan record (10.4% and 6.1%) is historical; Noa’s 7% is a planning assumption, guarded by the index-comparison footnote below the chart.
- Reading 7% as a guarantee. It is a planning convention, not a backtested or promised return, labeled as such in every table caption.
- Applying “do nothing” to short-horizon money. Noa assumes no near-term cash need, a case carved out by the scope box and Step 3.
| Parameter | Value |
|---|---|
| Starting balance | $200,000 |
| Monthly contribution | $500 |
| Assumed return | 7% annual (planning convention) |
| Time invested | 20 years (age 45 to 65) |
You probably expect a surprise cut to lift the market several percent on the day it lands.
Readers anchor on the size of the rate change and assume the market moves in rough proportion to it.
The crack shows in the record: ten unpredictable days, clustered near the worst ones, decided most of the twenty-year outcome.
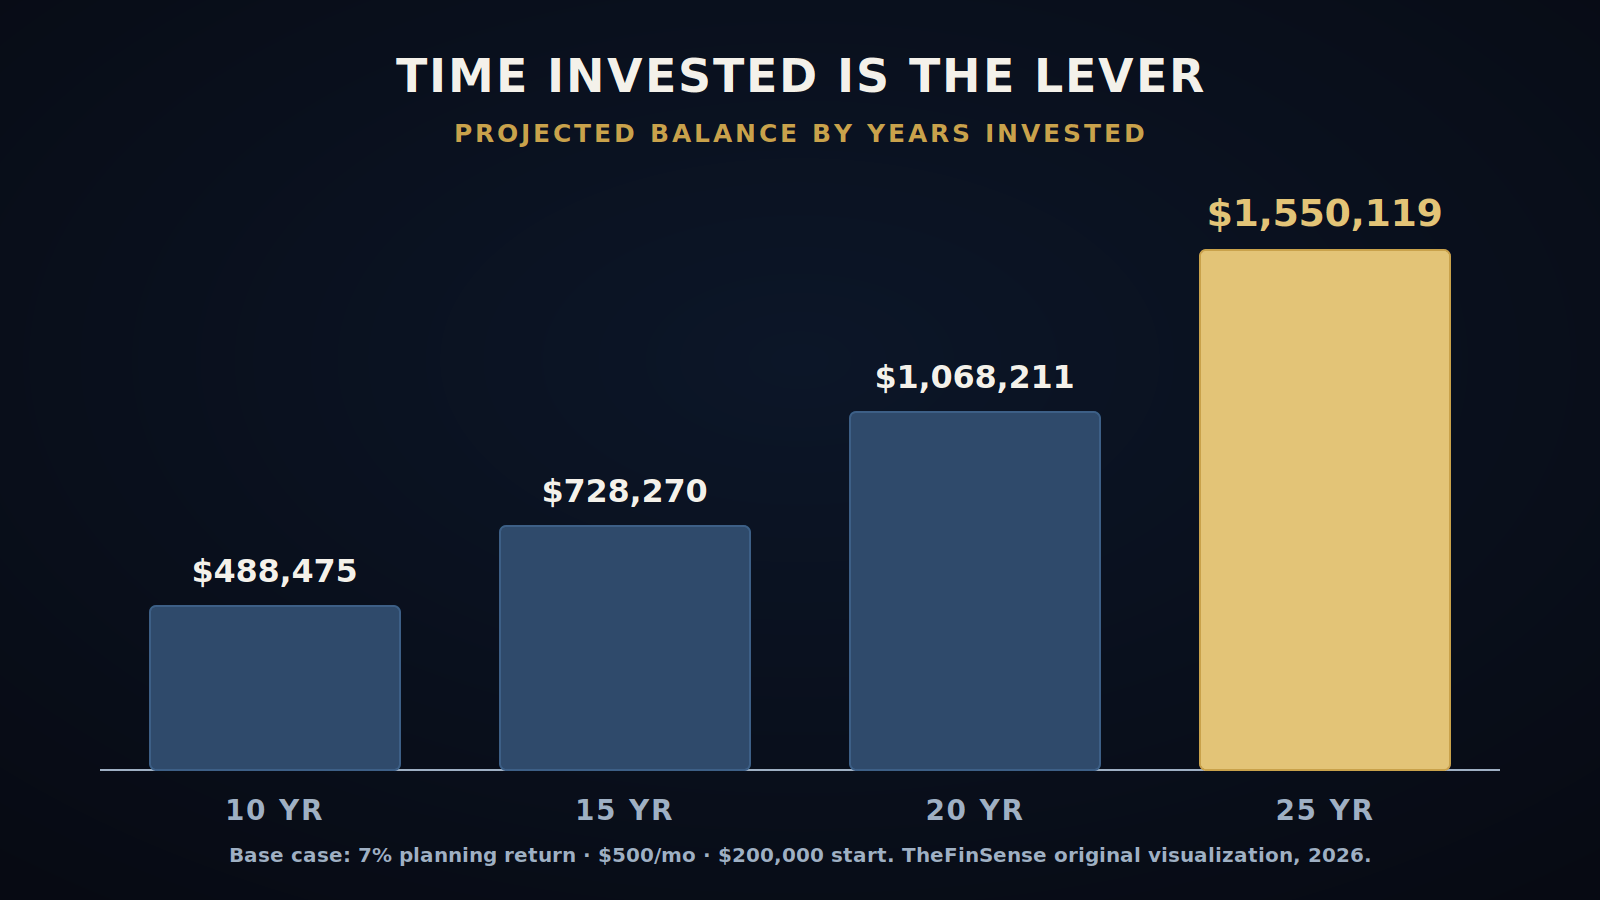
Scaled to a fuller portfolio, the same discipline of staying invested compounds quietly across the years. The forward-value milestones below assume the planning numbers above, and the fed rate decision portfolio impact never appears as a line item, because the meeting is not what builds the balance.
| Years invested | Projected balance |
|---|---|
| 5 years | $319,322 |
| 10 years | $488,475 |
| 15 years | $728,270 |
| 20 years | $1,068,211 |
| 25 years | $1,550,119 |
| Scenario | Ending value |
|---|---|
| Fully invested | $71,750 |
| Missed 10 best days | $32,871 |
The J.P. Morgan figures use the S&P 500 Total Return Index, which assumes dividends are reinvested, over the window from January 2005 through December 2024. Total Return differs from a Price Return index, which excludes dividends and would show lower compounding. You cannot invest directly in an index, and the figures are gross of fees, so a real fund would return somewhat less. The annualized rates quoted, near 10.4% fully invested and 6.1% missing the ten best days, belong to that exact window and are not a forecast. Noa’s separate projection uses a flat 7% annual assumption applied to monthly contributions, a planning convention rather than a historical S&P 500 result. The two should not be read as the same calculation, because one is a historical illustration and the other is a forward-value estimate.
Back on FOMC morning, Noa’s finger still hovers over the sell button. The fear is the meeting. The actual risk is the rebound that tends to land in the days right after the drop, while the cash is parked on the sideline.
Twenty years pass. $71,750 either becomes $32,871. Or it does not. Ten days decide.
Sensitivity table: 11 scenarios
These rows show how Noa’s projected balance shifts with return, contribution, and time invested; none of them depend on guessing a Fed meeting.
| Scenario | What changes (all else held at base) | Projected balance |
|---|---|---|
| Base case | 7% / $500 mo / 20 yr / $200,000 | $1,068,211 |
| Lower return | Return 5% | $748,045 |
| Below-base return | Return 6% | $893,061 |
| Above-base return | Return 8% | $1,279,871 |
| Higher return | Return 9% | $1,535,774 |
| No new contributions | Contribution $0/mo | $807,748 |
| Lower contribution | Contribution $250/mo | $937,979 |
| Higher contribution | Contribution $750/mo | $1,198,443 |
| Highest contribution | Contribution $1,000/mo | $1,328,674 |
| Shorter horizon | 10 years invested | $488,475 |
| Mid horizon | 15 years invested | $728,270 |
| Longer horizon | 25 years invested | $1,550,119 |
At a 25-year horizon, the same plan projects to $1,550,119. The lever with the largest payoff is the one fully in your control, years in the market, not the meeting you cannot forecast.
The same arithmetic sits inside your own account. Whatever your balance, the days that matter most arrive without a calendar invite, which is exactly why a written plan beats a forecast. To go deeper, see how a written plan, set out in an investment policy statement, holds steady through a Fed week.
Across twenty years, ten days you cannot predict in advance, not any meeting, decided whether $10,000 became $71,750 or $32,871.
That points to a more useful question than predicting the Fed.
What Should You Actually Do Before a Fed Meeting?
If ten unpredictable days carried the whole record, the real question becomes what a long-term investor should actually do about a Fed meeting.
Staying invested is not the same as ignoring your circumstances, and some situations make adjusting before a meeting reasonable. An investor who needs the money within a year, or who is managing withdrawals in retirement, should hold the right amount in cash whatever the Fed does. Nakamura and Steinsson also showed that markets sometimes move the opposite way you would expect, because a policy surprise can shift the outlook for growth, not only rates. None of that argues for guessing the meeting; it argues for a plan that already accounts for your time horizon and cash needs.
Step 1: Map your time horizon
Start by writing down when you actually need the money, because the right answer to a Fed meeting depends on your horizon, not the headline. An investor twenty years from retirement, like the composite Noa, treats an FOMC week differently from someone needing cash within a year.
Step 2: Set a rebalance rule in advance
Decide in advance how often you rebalance and to what target allocation, then put it in writing. A fixed calendar rule, such as once or twice a year regardless of the FOMC schedule, removes the pre-meeting reflex that Bernanke and Kuttner show rarely pays off.
A documented target is the backbone of rebalancing a diversified portfolio, and it works precisely because it ignores the meeting calendar.
Step 3: Hold near-term cash separately
Hold any money you need within a year in cash or short-term instruments, separate from your long-term portfolio. This is the one legitimate adjustment around a Fed meeting, and Nakamura and Steinsson note that policy surprises can move markets either way, so guessing is not a plan.
Step 4: Log the FOMC date, then do nothing
Mark the FOMC dates on your calendar, then deliberately take no trading action on them. J.P. Morgan Asset Management data shows the best days cluster near the worst, so sitting through the June 2026 meeting rather than selling is what keeps a stake compounding toward its long-run value.
If yes, hold it in cash regardless of the Fed.
If yes, adjust the plan, not the timing.
If yes, follow your written rule.
Cash need or changed horizon: adjust deliberately. Just another meeting: let the plan run.
If a meeting genuinely changes your time horizon or cash needs, trimming risk can be sound, and this is not blind buy-and-hold.
Following your written plan through the next FOMC week is what keeps a stake on the higher path rather than the timed one.
Step back and the sound move reveals itself: follow a written plan, because the meeting you fear is rarely the one that matters.
Who Should Use a Different Approach?
Repositioning makes sense when a near-term cash need, not a Fed forecast, is driving the decision.
Adjusting before a Fed meeting makes sense only when a real circumstance, not a forecast, demands it. An investor six months from a home down payment, or a retiree managing sequence-of-returns risk, should hold the right cash buffer regardless of what the FOMC decides in June 2026.
Rebalance on a fixed schedule and to your written plan, not to the FOMC calendar.
Next time a Fed meeting dominates the headlines, ask whether the move is already priced, not whether to act.
We will update this after the June 17, 2026 FOMC decision and the new dot plot.
That leaves a sharper question: which meeting actually matters to your plan, and which is just noise?
Fed Rate Decisions and Your Portfolio: Frequently Asked Questions
The common thread across these questions is that a Fed rate decision matters less to a diversified portfolio than most headlines suggest. Markets price the expected move in advance, react mainly to the surprise, and feel real-economy effects only after long and variable lags. Bond prices respond more directly to rate changes than stocks do, and a cut is not automatically good news if it signals a weakening economy. For most long-term investors, the practical answer is to follow a written plan rather than trade around the FOMC calendar.
Does a Fed rate decision move my portfolio?
A Fed rate decision moves your portfolio far less than the headlines imply, because markets price the expected move into stocks before the meeting. Bernanke and Kuttner found the S&P 500 reacts to the surprise in a decision, near 1% per unanticipated quarter-point, rather than the announced rate itself. For a diversified long-term investor, a widely anticipated hold or cut usually produces only a small same-day move. That is why repositioning around the meeting tends to cost more in missed rebound than it saves in avoided risk.
Why does the surprise matter more than the rate?
The surprise matters more than the rate because only new information moves prices, and the rate level is largely known in advance. When the decision matches what traders already expected, the outcome is baked into prices days earlier, so the gavel barely registers. The unexpected gap between forecast and outcome is the only fresh input, which is what the same-day move reflects. Forward guidance about future policy can carry an even larger surprise than the rate number, which is why a single sentence from the Fed sometimes moves markets more than the decision.
Should I sell stocks before a Fed meeting?
Selling stocks before a Fed meeting rarely helps a long-term investor, because the best trading days tend to cluster within about two weeks of the worst ones. J.P. Morgan Asset Management data shows a $10,000 stake fully invested from 2005 to 2024 reached $71,750, while missing only the ten best days cut it to $32,871. Stepping out to dodge a meeting risks sitting out the rebound that follows the drop. Unless you have a genuine near-term cash need, staying invested through the meeting is usually the stronger move.
How do Fed rate decisions affect bond prices?
Fed rate decisions affect bond prices more directly than they affect stocks, because bond values move inversely to interest rates. When rates rise, existing bonds with lower coupons lose value, and when rates fall, those bonds gain. Longer-maturity bonds react more sharply than short-term ones to the same change. For a fuller picture, see our guide on how bonds work. Even so, much of an expected rate path is already reflected in the yield curve before the FOMC announces anything.
When do Fed rate changes hit the economy?
Fed rate changes reach the real economy only after long and variable lags that can run many months, while financial markets price the expected effect almost immediately. That gap is the practical heart of the matter. By the time a cut shows up in hiring or borrowing costs, markets have usually moved on the anticipation rather than the event. For a long-term investor, this separates two things worth keeping apart. The market reaction you see on decision day reflects the surprise, not the eventual economic impact, and a rate cut is not automatically good news if it signals a weakening economy. The disciplined response is to hold to a written plan that already accounts for your horizon and cash needs, rather than trading on where you think the lagged effects will land.
Fed Rate Decision Portfolio Impact: The Bottom Line
The distance between $71,750 and $32,871 came down to staying invested through the meetings, not predicting them.
The mechanism is the whole argument. Bernanke and Kuttner showed that stock prices respond to the surprise in a decision, not the announced rate, so a widely expected move is mostly priced before the gavel. That is why the pre-meeting reflex, the urge to act on the calendar, works against a long-term investor more often than for one.
Each skipped rebound is irreversible, and the compounding it would have started does not return.
Open your brokerage today and set a calendar rebalance; if you see an FOMC-week sell order, pause it.
The move you try to dodge is the one already priced in, and the move that matters arrives while you are out.
The Fed will keep deciding and headlines will keep urging action. But the twenty-year record is blunt: ten unpredictable days, not the FOMC calendar, decided whether $10,000 became $71,750 or $32,871.
You are the investor who builds a plan and trusts it through noise.
When the next meeting looms, your edge is the plan already written.
Next read
Twenty years on, Noa’s account reflects time invested, not meetings dodged.
Stay on the platform and let the train come back, because the climb you wait for usually arrives right after the drop you feared.
YOUR TURN
The next time a Fed decision takes over the headlines, will you open your written plan or the sell screen?
Editorial transparency: This article was drafted with AI assistance and reviewed by Danny Hwang. All calculations were independently verified in Python (verification notebook on GitHub). All citations were manually checked against primary sources.
Educational quantitative analysis based on published data. Not investment, tax, or legal advice. Consult a licensed professional before acting on any calculation. About TheFinSense.

