
Published: · Last updated:
Return on equity is useful only when shareholder equity is positive and the equity base has not been thinned by buybacks or paired with rising leverage. Damodaran’s January 2026 data shows 14.44% aggregate R&D-adjusted ROE for the U.S. market without financials, but that figure does not tell us how many individual companies clear the common cutoff. Before trusting a high ROE, check the equity base, leverage, sector benchmark, and earnings quality.
A stock screener flashes an 18% return on equity and gives the company a green quality badge. Then you open the balance sheet and find that shareholder equity fell because the company borrowed money and bought back shares. Earnings barely moved, yet the ratio still improved.
That is the practical problem with return on equity: earnings can look healthy while the equity base is shrinking, stale, or negative. A single cutoff cannot tell those stories apart.
The useful question is not whether a round-number cutoff is magic. Ask whether the company earned that ROE through durable business performance or through an equity base that became easier to divide by.
What Does a 15% Return on Equity Actually Tell You?
Return on equity equals net income divided by average shareholders’ equity. A 15% ROE means the company earned about $15 of net income for every $100 of average book equity during that period.
The ratio compresses three different forces into one number:
- Profit margin: how much profit the company keeps from each dollar of sales.
- Asset efficiency: how much revenue the company produces from its asset base.
- Financial leverage: how much of the asset base is financed with equity rather than liabilities.
This is why two companies can report the same ROE while carrying very different business risk. One may earn strong margins with little debt, while the other reaches the same result because its equity base is thin.
Some investors use 15% as a screening threshold, but the cutoff is not a rule from Buffett’s 1979 Berkshire Hathaway letter. Buffett’s point was narrower: a high return on equity is more impressive when it does not depend on heavy leverage or accounting maneuvers. Treat 15% as a starting screen, not a universal quality test.
Primary source: Berkshire Hathaway 1979 shareholder letter
Damodaran’s January 2026 U.S. dataset reports 14.44% R&D-adjusted ROE for the total market without financials. The figure combines 4,822 firms; it is not the median company and does not show how many firms sit above the screen.
Do not convert the small difference between the screen and the aggregate benchmark into an expected stock-return difference. ROE is an accounting profit ratio, not an annual portfolio return. Compounding that gap as if it were an investment premium creates a precise dollar result from two measures that do not mean the same thing.
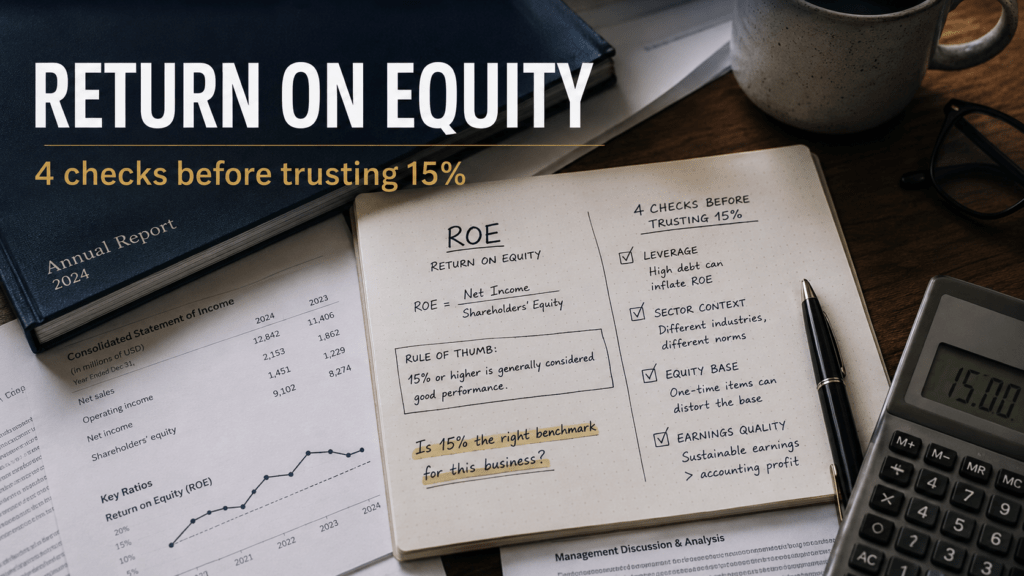
Four Checks Before You Trust Return on Equity
A good ROE review does not require a complicated model. The four checks below catch most of the ways the ratio can mislead an investor.
Check 1: Is Shareholder Equity Positive and Stable?
Start with beginning and ending shareholders’ equity, then use their average as the ROE base instead of relying only on the latest balance-sheet figure.
- If equity is positive and broadly stable, the ratio remains interpretable.
- If equity fell sharply, ask whether losses, dividends, deals, or buybacks caused the decline.
- If equity is close to zero, a small denominator can create an extreme ROE.
- If equity is negative, the math may produce a negative percentage, but the result is not useful for a normal peer test.
The same equity-base problem can also break the debt-to-equity ratio. Once book equity turns negative, both ratios stop working like normal peer tools.
Check 2: Are Leverage or Buybacks Doing the Work?
Compare ROE with return on invested capital, debt trends, and buybacks. ROIC is not standardized across every issuer, so check the formula, but it is less directly affected by a shrinking equity base.
A widening ROE-to-ROIC spread is a reason to investigate, not a sell signal by itself. Check whether debt rose, treasury stock expanded, or retained earnings fell. S&P 500 companies spent $942.5 billion on buybacks in 2024. At an individual company, buybacks reduce shareholders’ equity, so they can lift ROE without stronger earnings.
Primary source: S&P Dow Jones Indices, 2024 buyback report
Check 3: Is the Sector Benchmark Comparable?
Capital structure, asset age, regulation, and accounting treatment vary by industry. A water utility and a software company should not be judged against the same raw cutoff without context.
The benchmark must match the metric you are using, because Damodaran publishes both raw ROE and an R&D-adjusted version. Do not compare a company’s raw filing number with an adjusted sector figure as if they were the same measure.
Check 4: Do Cash Flow and Earnings Quality Support the Ratio?
ROE uses net income, so it also carries the limits of accrual accounting. Compare net income with cash from operations, then inspect unusual gains, charges, and repeated working-capital changes.
A high ROE backed by recurring cash flow deserves more confidence than the same ratio produced by a one-time gain. The cash flow statement is where that difference usually becomes visible.
| Check | What to inspect | Warning sign | Practical response |
|---|---|---|---|
| Equity base | Beginning, ending, and average equity | Near-zero, sharply falling, or negative equity | Stop using raw ROE as a peer-quality score |
| Capital structure | Debt, buybacks, ROIC, treasury stock | ROE rises while equity falls or debt rises | Separate operating performance from financing |
| Sector context | Comparable industry and same adjustment basis | Universal cutoff applied across unlike sectors | Use a dated, like-for-like sector benchmark |
| Earnings quality | Operating cash flow and unusual items | Net income rises without cash support | Reconcile the income statement with cash flow |
Fast screen: pull net income, beginning and ending equity, cash from operations, beginning and ending debt, and share buybacks from the same reporting period. The calculator below turns those inputs into an equity-base check.
ROE Quality Check Calculator
This tool does not grade a stock or forecast its return. It computes ROE from average equity and checks whether the equity base stayed positive. It also flags debt growth, buybacks, or weak cash support that may deserve a closer look. Enter every monetary figure in the same unit, such as millions of dollars.
Test whether a reported ROE is interpretable before you treat it as a quality signal.
Method in brief: Use figures from the same reporting period and the same monetary unit. The tool calculates average equity, ROE, changes in equity and debt, cash-flow coverage of net income, and buybacks relative to average equity. If beginning or ending equity is zero or negative, it stops the normal ROE peer test instead of treating the math as a useful score. It uses no sector cutoff and makes no stock-return forecast.
AutoZone: Profitable, but Standard ROE Breaks
AutoZone shows why a negative equity base should not be read as an automatic verdict on business quality.
Its Form 10-Q for the quarter ended May 9, 2026 reported $641.5 million of quarterly net income. The same filing showed a stockholders’ deficit of $2.785 billion, compared with a $3.414 billion deficit at August 30, 2025.
Positive income divided by negative average equity produces a negative ROE. The math works, but the usual peer test does not, so a profitable company can show a negative ROE after buybacks and other changes push book equity below zero.
| Metric | Reported value | What it tells the ROE reader |
|---|---|---|
| Q3 FY2026 net income | $641.5 million | The company remained profitable during the quarter |
| Stockholders’ deficit, May 9, 2026 | $2.785 billion deficit | The standard equity denominator is negative |
| Stockholders’ deficit, August 30, 2025 | $3.414 billion deficit | The denominator was already negative at fiscal year-end |
| Adjusted after-tax ROIC, trailing four quarters | 36.3% | Company-defined non-GAAP return-on-capital measure; use only with its stated formula |
| Repurchases since January 1, 1998 | 156.0 million shares for $39.8 billion | Long-running buybacks materially shaped book equity |
Primary source: AutoZone Form 10-Q, quarter ended May 9, 2026
AutoZone does not prove that buybacks are good or bad. It proves something narrower and more useful: once equity is negative, standard ROE no longer answers the question investors think it answers.
No single ratio replaces ROE. Review margins, cash flow, debt load, and an ROIC measure with a clear formula. That broader review is also closer to how an economic moat should be judged: through durable business strength, not one accounting output.
How Should Investors Compare ROE Across Sectors?
Damodaran’s January 2026 dataset makes the sector problem visible. Selected R&D-adjusted figures range from 3.25% for specialty chemicals to 20.21% for system and application software. Machinery sits near the common cutoff, while water utilities are closer to 10%.
| Industry | Number of firms | R&D-adjusted ROE |
|---|---|---|
| Software (System & Application) | 309 | 20.21% |
| Machinery | 105 | 15.11% |
| Aerospace/Defense | 79 | 11.32% |
| Utility (Water) | 14 | 10.27% |
| Chemical (Specialty) | 59 | 3.25% |
| Total Market without Financials | 4,822 | 14.44% |
Primary source: Damodaran, Return on Equity by Sector (US), January 2026
The table does not rank sector appeal; it shows that the baseline changes by industry. A 12% ROE may be ordinary in one sector and strong in another, while a 20% ROE may still lag peers with cleaner balance sheets.
Return on Equity FAQ
What is a good return on equity?
A good ROE stays positive over time, is backed by cash flow, and compares well with similar companies that use similar leverage. A cutoff such as 15% can start the screen, but it is not a final quality verdict.
Is 15% return on equity rare?
Damodaran’s 14.44% January 2026 figure cannot answer how rare a 15% ROE is, because it combines the U.S. market without financial firms into one ratio. You need company-level data and a defined group of stocks to count how many firms exceed 15%.
Can return on equity be negative?
Yes, and the reason matters because ROE can turn negative when net income is negative, average equity is negative, or both. A loss on positive equity points to a loss-making business, while positive income over negative equity means the equity base no longer works for a normal peer test.
How do share buybacks affect ROE?
Buybacks can reduce shareholders’ equity through treasury stock, so reported ROE can rise even when net income does not change. The higher ratio may reflect a thinner equity base or more leverage rather than a stronger business.
Should I use ROIC instead of ROE?
Use both when you know how each ratio was calculated, because ROIC is less directly tied to a shrinking equity base but issuer formulas can differ. Check the formula against cash flow and debt, and do not let one ratio become the whole quality test.
The Bottom Line on Return on Equity
A high ROE can be useful, but it can also answer the wrong question.
Before trusting the ratio, make sure average equity is positive, then ask what changed the equity base. Compare the company with a similar sector group and confirm that cash flow supports earnings. Those checks help separate business strength from leverage, buybacks, and accounting effects.
One boundary matters most: do not turn an ROE difference into a stock-return forecast. The ratio can guide your next question, but it cannot supply a portfolio return premium by itself.
Try the four checks on one holding
Open its latest filing and compare beginning equity, ending equity, debt, operating cash flow, and repurchases. The denominator usually explains more than the green screener badge.
- Damodaran, NYU Stern: January 2026 U.S. sector ROE table. This article uses the R&D-adjusted column and labels the 14.44% nonfinancial total-market figure as an aggregate ratio.
- AutoZone Form 10-Q: Quarter ended May 9, 2026. Filing values are rounded from the SEC filing’s reported units; adjusted ROIC is a company-defined non-GAAP measure.
- S&P Dow Jones Indices: 2024 S&P 500 repurchase expenditure of $942.5 billion, used only to show the scale of market buybacks.
- Berkshire Hathaway: 1979 shareholder letter, used for Buffett’s leverage-and-accounting principle rather than a claimed 15% rule.
Method: Each load-bearing figure is tied to an official dataset, issuer filing, index provider, or Berkshire’s own letter. No backtest or portfolio-return model is used because this article is about accounting interpretation, not expected stock returns. Sector figures are dated snapshots, not forecasts.
Limits: ROIC definitions vary, accounting policies differ, and aggregate sector data does not describe every constituent. Financial firms, REITs, private companies, and international issuers may require different benchmarks.
Damodaran ROE dataset · AutoZone 10-Q · S&P DJI buyback report · Berkshire 1979 letter
AI-assisted editorial process: AI tools were used to organize source checks and identify internal inconsistencies. Danny Hwang reviewed the final reasoning, figures, source alignment, and wording against the cited primary or publisher-hosted materials. See the editorial policy.
Financial Disclosure
This article is for educational and informational purposes only. It is not personalized investment advice or a recommendation to buy, hold, or sell AutoZone or any other security.
Accounting ratios are starting points, not substitutes for reviewing complete financial statements, valuation, risk tolerance, time horizon, and portfolio context.
Update history
-
v2.1
2026-08-18
FACT & UTILITY UPDATEClarified the 15% screening reference, added the filing-based ROE Quality Check, refreshed source support for the 2026 figures, and simplified several sections so the four-check framework is easier to apply to a filing.
-
v2.0
2026-07-18
MAJOR CORRECTIONRemoved the unsupported $84,232 wealth projection and the claim that a 14.44% aggregate market ROE proves a 15% screen is not rare. Updated AutoZone to its May 9, 2026 filing, corrected the negative-equity explanation, and rebuilt the article around four denominator checks.
-
v1.0
2026-04-18
PUBLISHOriginal publication.