
📅 Originally Published: · Last Updated:
Cash flow statement analysis checks whether reported profit is turning into usable cash. Start with operating cash flow (OCF) and net income, then trace any gap through receivables, inventory, payables, capital spending, and funding.
One weak quarter is a prompt to dig deeper, not proof of distress. The signal gets stronger when the gap repeats and cannot be tied to a seasonal cycle, fast growth, a change in company scope, or a one-time item.
An earnings release can look strong while cash tells a different story. That does not mean the earnings are fake. It means you need to connect the statements before deciding whether the quarter was healthy, cash-hungry for a clear reason, or getting worse.
This goes wrong when one ratio becomes a one-size-fits-all alarm. Use the ratio to find a gap, then read the balance-sheet changes and filing notes that explain it.
When Sales Rose and Cash Fell: Owens Corning Q1 2025
Owens Corning’s first-quarter 2025 release is useful because sales rose while cash went out. The company reported $2.53 billion in net sales from continuing operations, up 25% from the prior-year quarter. Net earnings from continuing operations attributable to Owens Corning were $255 million, down 8% from $278 million a year earlier. The release also showed a $49 million OCF outflow and a $252 million free cash flow outflow for the full company, including discontinued operations.
| Measure | Reported amount | First reading |
|---|---|---|
| Net sales from continuing operations | $2.53 billion | Up 25% year over year |
| Net earnings from continuing operations attributable to Owens Corning | $255 million | Positive, but down 8% year over year |
| Operating cash flow, full company | -$49 million | Includes discontinued operations |
| Free cash flow, full company | -$252 million | Company-defined measure; includes discontinued operations |
Do not divide the $49 million OCF outflow by the $255 million earnings figure. Those figures cover different scopes. The $255 million profit figure covers continuing operations, while the $49 million OCF figure covers the full company, including discontinued operations. The arithmetic works, but the ratio would compare unlike bases.
The company’s Form 10-Q shows why scope matters. Its consolidated statement starts with a $93 million total net loss and then adjusts for discontinued operations. Owens Corning said the cash outflow mainly came from more inventory and other business assets, plus a smaller rise in accounts payable. Higher cash earnings and a smaller rise in receivables offset part of that use.
What the example proves: Match the reporting scope before you calculate a ratio. Once the scope matches, trace the gap through working capital to see why cash moved differently from earnings.
What it cannot prove: One negative quarter cannot establish structural distress, imminent bankruptcy, or poor long-term stock returns.
The right response is neither “ignore the cash outflow” nor “sell because OCF is negative.” First match the reporting scopes, then ask whether the cash use is short-lived, tied to growth, and likely to reverse. Check the same accounts over the next several quarters before drawing a firm conclusion.
Why Profit and Cash Diverge
Accrual accounting records revenue and expenses when the business activity occurs, not only when cash moves. This helps the income statement measure the period, but net income and OCF will often differ.
The statement splits cash into operating, investing, and financing sections. For most nonfinancial companies, OCF is the first check on whether earnings became cash. Changes in balance-sheet accounts then show where cash was tied up or released.
| Source of the gap | What can happen | What to inspect |
|---|---|---|
| Accounts receivable | Revenue is recognized before customers pay | Receivables growth, days sales outstanding, credit terms, and allowances |
| Inventory | Cash is spent before goods are sold | Inventory growth, turnover, demand assumptions, and markdown risk |
| Accounts payable | Supplier-payment timing temporarily raises or lowers cash flow | Payables growth, payment terms, and supplier-financing disclosures |
| Deferred revenue or contract liabilities | Cash arrives before revenue is recognized | Renewals, delivery obligations, and customer concentration |
| Non-cash charges | Expenses reduce earnings without an immediate cash outflow | Depreciation, amortization, stock compensation, impairments, and provisions |
| Taxes and other timing items | Cash taxes and recognized tax expense differ by period | Tax footnotes, deferred taxes, settlements, and one-time payments |
None of these items is good or bad by itself. Rising inventory can support a planned launch or warn that goods are not selling. Higher receivables can come with growth or point to slower collections. Longer supplier terms can help near-term cash or put pressure on vendors. The filing and the trend over several quarters tell you which view fits best.
This is why you should read the cash flow statement with the income statement and balance sheet. The income statement shows what the company earned under accrual rules. The cash statement shows how those earnings affected cash during the period.
What the Research Supports, and Where It Stops
Research gives investors a reason to look at cash-based measures. These studies are not a return forecast for a personal portfolio.
| Study | What it measured | Reasonable takeaway | What it cannot establish |
|---|---|---|---|
| Almamy, Aston, and Ngwa (2016) | Company-failure prediction for UK companies using a J-UK model that adds a cash-flow ratio to re-estimated Altman variables | The model reported 82.9% predictive power and higher accuracy than the re-estimated Altman model in the study sample | A universal bankruptcy cutoff for any single company or quarter |
| Ball, Gerakos, Linnainmaa, and Nikolaev (2016) | Cross-sectional stock-return tests using cash-based operating profitability | Cash-based profitability contained useful return information and improved the research factor’s Sharpe ratio | An investor’s expected annual return from checking one company filing |
The studies answer different questions: Almamy and co-authors tested a business-failure model, while Ball and co-authors tested stock-return factor portfolios. Neither result should be treated as a forecast for one stock.
Ball and co-authors found that a cash-based profit measure added signal in their cross-sectional return tests. In Table 5, the cash-based factor had stronger statistics than the standard operating-profit factor over July 1963 through December 2014. Those are long-short research results, not expected returns for one stock or a household account.
The useful takeaway is narrower: reported profit alone cannot settle earnings quality. Cash-based measures can add evidence, but the company filing still tells you what happened in a given quarter.
How to Read the Statement in Four Steps
Step 1: Compare Cash Conversion Over Several Periods
Only divide OCF by net income when both figures cover the same period and the same business scope. Then repeat the check across several quarters or on a trailing-twelve-month basis. If the scopes differ, do not force the ratio.
Start with the current quarter, but do not stop there. A seasonal business may use cash early in the year and recover it later. A growing business may build inventory before the sales arrive. A trailing-twelve-month view and the same quarter a year ago help separate timing from a real decline.
When net income is near zero or negative, the ratio can swing too much to help. In that case, compare OCF in dollars with revenue, gross profit, and the main working-capital changes.
Step 2: Build the Working-Capital Bridge
Trace the biggest cash uses and sources in receivables, inventory, payables, and contract liabilities. Find which account created most of the gap, then check whether management’s stated reason matches the numbers.
Look for the accounts that moved enough to explain the gap between profit and cash. Then compare each one with the business measure it should follow. Check receivables against sales, inventory against cost of goods sold and demand, and payables against purchases and supplier terms.
A vague “working capital” reason is not enough when one line item drives most of the outflow. The filing should let you find the main cause.
Use this as a screening tool after you have checked the filing. Enter the GAAP earnings figure and OCF in the same units, then tell the tool whether both figures cover matching dates and the same business scope. Working-capital changes are optional; enter balance increases as positive numbers and decreases as negative numbers.
Cash Flow Diagnostic
Check whether an OCF-to-earnings ratio is valid, then screen the main working-capital changes that may have absorbed or released cash.
| Item | Balance change | Cash effect | First read |
|---|
Use the same units for every dollar input. The tool never assigns a distress score or a universal “good” ratio.
Step 3: Core Cash vs. Reinvestment
OCF shows cash made or used by the core business. A common free-cash-flow measure subtracts capital spending from OCF, but free cash flow is company-defined and formulas can vary. Check the stated formula before comparing periods or peers.
Negative free cash flow can point to a weak business, but it can also come from planned investment. Check capital-spending guidance, cash paid for deals, asset-sale proceeds, and management’s split between growth and upkeep. The statement shows the amount; the notes tell you why the company spent it.
Do not lump cash paid for deals, financing flows, and routine capital spending into one distress claim. They mean different things for the business.
Step 4: Test Liquidity and Financing Dependence
Review cash on hand, debt maturities, unused credit lines, interest cost, covenant terms, and financing flows. A profit-to-cash gap matters more when the company has little liquidity or keeps raising outside funds to cover normal needs.
Borrowing during weak OCF does not prove debt funded the core business. The company may be refinancing debt, funding a deal, buying back stock, or changing its capital structure. Read the debt note and financing section before deciding why it borrowed.
Finally, compare the trend with close peers. Seasonal patterns, payment terms, inventory cycles, and how much capital the business needs can make the same ratio mean very different things across sectors.
When a Weak Ratio Can Be a False Alarm
A weak OCF-to-net-income ratio deserves attention, but common cases can create a short-term gap without pointing to a broken business.
- Seasonal timing: Inventory buys, annual bonuses, tax payments, or customer collections may cluster in one quarter.
- Fast growth: A company may need more inventory and receivables before the related cash collections arrive.
- M&A or discontinued operations: Reported earnings and company-wide cash may cover different scopes or include transition costs.
- One-time settlements: Litigation, restructuring, pension contributions, and tax payments can depress cash flow for a limited period.
- Sector differences: Banks, insurers, real estate investment trusts, and pre-revenue companies need measures that a basic OCF-to-net-income screen does not capture well.
The opposite error also matters. Strong OCF can be boosted for a time by delaying supplier payments, collecting customer cash early, or cutting inventory too far. A ratio above 1.0x is not proof of high earnings quality.
A practical escalation rule: Dig deeper when the gap is much worse than the company’s history or peers and lasts beyond a normal seasonal or investment cycle.
Raise the concern when the same period also shows slower collections, inventory buildup without demand support, less liquidity, covenant pressure, or repeated need for outside funding.
Cash Flow Statement Analysis FAQ
What is cash flow statement analysis?
Cash flow statement analysis reviews where a company gets and uses cash across operating, investing, and financing sections. For investors, the main question is whether reported earnings turn into cash and, if not, what caused the gap.
Is negative operating cash flow always bad?
No. Negative OCF can come from seasonal timing, fast growth, inventory builds, payment timing, M&A-related working-capital changes, or one-time cash costs. It is more concerning when it repeats, has no clear business reason, and comes with weaker liquidity or greater funding pressure.
What does the OCF-to-net-income ratio show?
The ratio compares OCF with net income only when both cover the same period and the same business scope. It can flag a profit-to-cash gap, but there is no one-size-fits-all distress cutoff. Read it across several periods and beside working capital, peer norms, and filing notes.
How can a profitable company run out of cash?
A company can recognize revenue before customers pay, build inventory, make large cash investments, or face debt and supplier obligations before collections arrive. Accounting profit does not remove the need to meet cash obligations on time.
Which financial statement should an investor read first?
Start with the earnings headline only to understand the reported result. Then read the income statement and cash flow statement together, followed by the balance sheet and notes. The 10-K reading guide shows how to connect those statements.
Can cash flow analysis predict bankruptcy by itself?
No. Cash data can improve a broader failure-screening model, but bankruptcy risk also depends on debt, liquidity, profits, market stress, debt maturities, and access to funding. Use it as one part of a wider company bankruptcy analysis.
Cash Flow Statement Analysis: The Bottom Line
Cash flow statement analysis is most useful when it points to the next question. A profit-and-cash gap should send you to working capital, capital spending, liquidity, and the filing notes. It should not trigger an instant buy, sell, or bankruptcy verdict.
For your next earnings review, first confirm that OCF and net income cover the same period and business scope. If they do, compare several periods and find the two or three accounts that explain the gap. Then decide whether the cash use is short-lived and useful, or repeated and harder to fund.
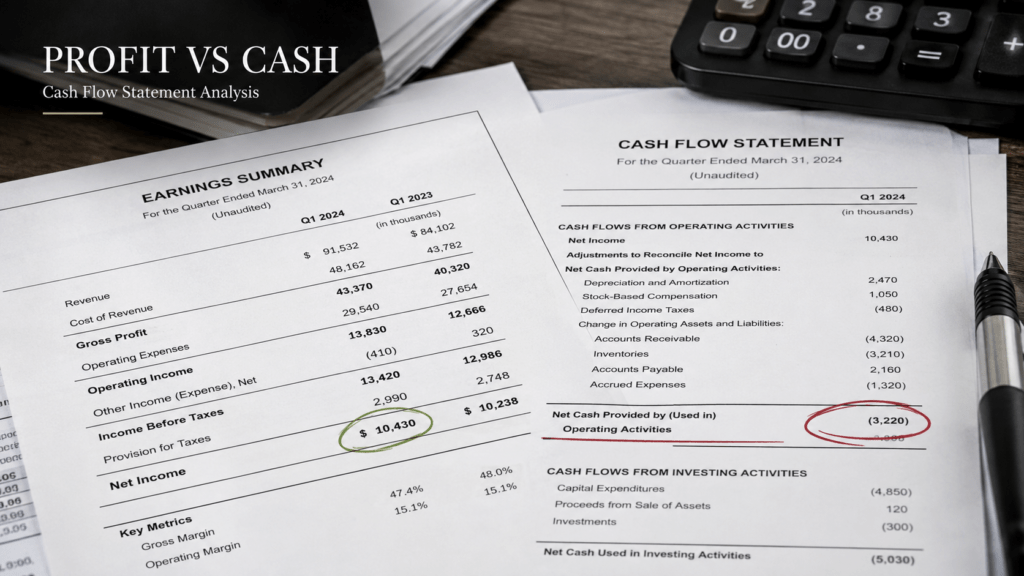
The income statement records profit, while the cash flow statement shows where cash actually moved.
Check the explanation, not only the ratio
When profit and cash diverge, write down the filing’s stated cause and the account that should confirm it next quarter. That creates a testable follow-up instead of a one-quarter narrative.
- Owens Corning, Q1 2025 results and Form 10-Q: The release reports $2.53 billion of net sales from continuing operations, $255 million of net earnings from continuing operations attributable to Owens Corning, a $49 million operating cash outflow, and a $252 million free cash outflow. The release explicitly labels the two cash-flow figures as full-company measures that include discontinued operations. The 10-Q’s consolidated cash flow statement starts from a $93 million total net loss and includes discontinued-operations adjustments. Company release · SEC filing
- Almamy, Aston, and Ngwa (2016): The UK corporate-failure study adds a cash-flow ratio to re-estimated Altman variables and reports 82.9% predictive power in its study sample. The result is evidence about a model and sample, not a universal company-level distress cutoff. Journal record
- Ball, Gerakos, Linnainmaa, and Nikolaev (2016): The paper tests cash-based operating profitability in the cross-section of stock returns. Table 5 covers July 1963 through December 2014 and reports stronger factor statistics for cash-based operating profitability than for the operating-profitability factor. These are research-factor results, not household return assumptions. Journal record · Full paper
- SEC and FASB guidance: SEC investor guidance describes the cash flow statement as a period statement of cash exchanges, while FASB’s conceptual framework explains that accrual accounting recognizes economic effects in periods that can differ from the related cash receipts or payments. SEC financial-statement guide · FASB Concepts Statement 8, Chapter 4
Method: This article only forms an OCF-to-net-income ratio when the numerator and denominator cover the same period and a compatible reporting scope. It intentionally does not calculate that ratio for Owens Corning Q1 2025 because the $255 million earnings figure is continuing-operations only while the $49 million operating cash outflow is a consolidated full-company figure that includes discontinued operations. The interactive calculator follows the same fail-closed rule. Its working-capital bridge is directional: receivables and inventory increases are treated as cash uses, while accounts-payable increases are treated as a cash source; it is not a substitute for the full filing reconciliation.
Limitations: The academic studies use specific samples and model definitions. Their findings support the informational value of cash-based measures but do not create a universal company-level cutoff, prove causation for one firm’s stock returns, or guarantee future performance.
AI disclosure: AI tools assisted with source organization, consistency checks, and markup review. Danny Hwang reviewed the primary-source evidence, reporting-scope logic, and final article.
Correction
August 16, 2026: Removed the Owens Corning -0.19x ratio because the earnings and OCF figures covered different scopes. Also corrected the case heading and the Ball et al. research description.
July 17, 2026: Removed the unsupported $264,728 portfolio projection, removed unverified universal ratio thresholds, and rebuilt the article around company filings and narrower research claims.
Update history
-
v2.2
2026-08-16
UTILITY UPDATEAdded a scope-aware cash flow diagnostic calculator with a directional working-capital bridge. The tool blocks the ratio when reporting scope differs or the GAAP earnings figure is non-positive.
-
v2.1
2026-08-16
FACT CORRECTIONAligned the Owens Corning example by reporting scope, corrected the research locator and sample description, and updated internal links and trust markup to the current article contract.
-
v2.0
2026-07-17
FACT CORRECTIONRebuilt the analysis around verified company filings and removed unsupported return projections and universal ratio thresholds.
-
v1.0
2026-04-15
PUBLISHOriginal publication.