
📅 Originally Published: · Last Updated:
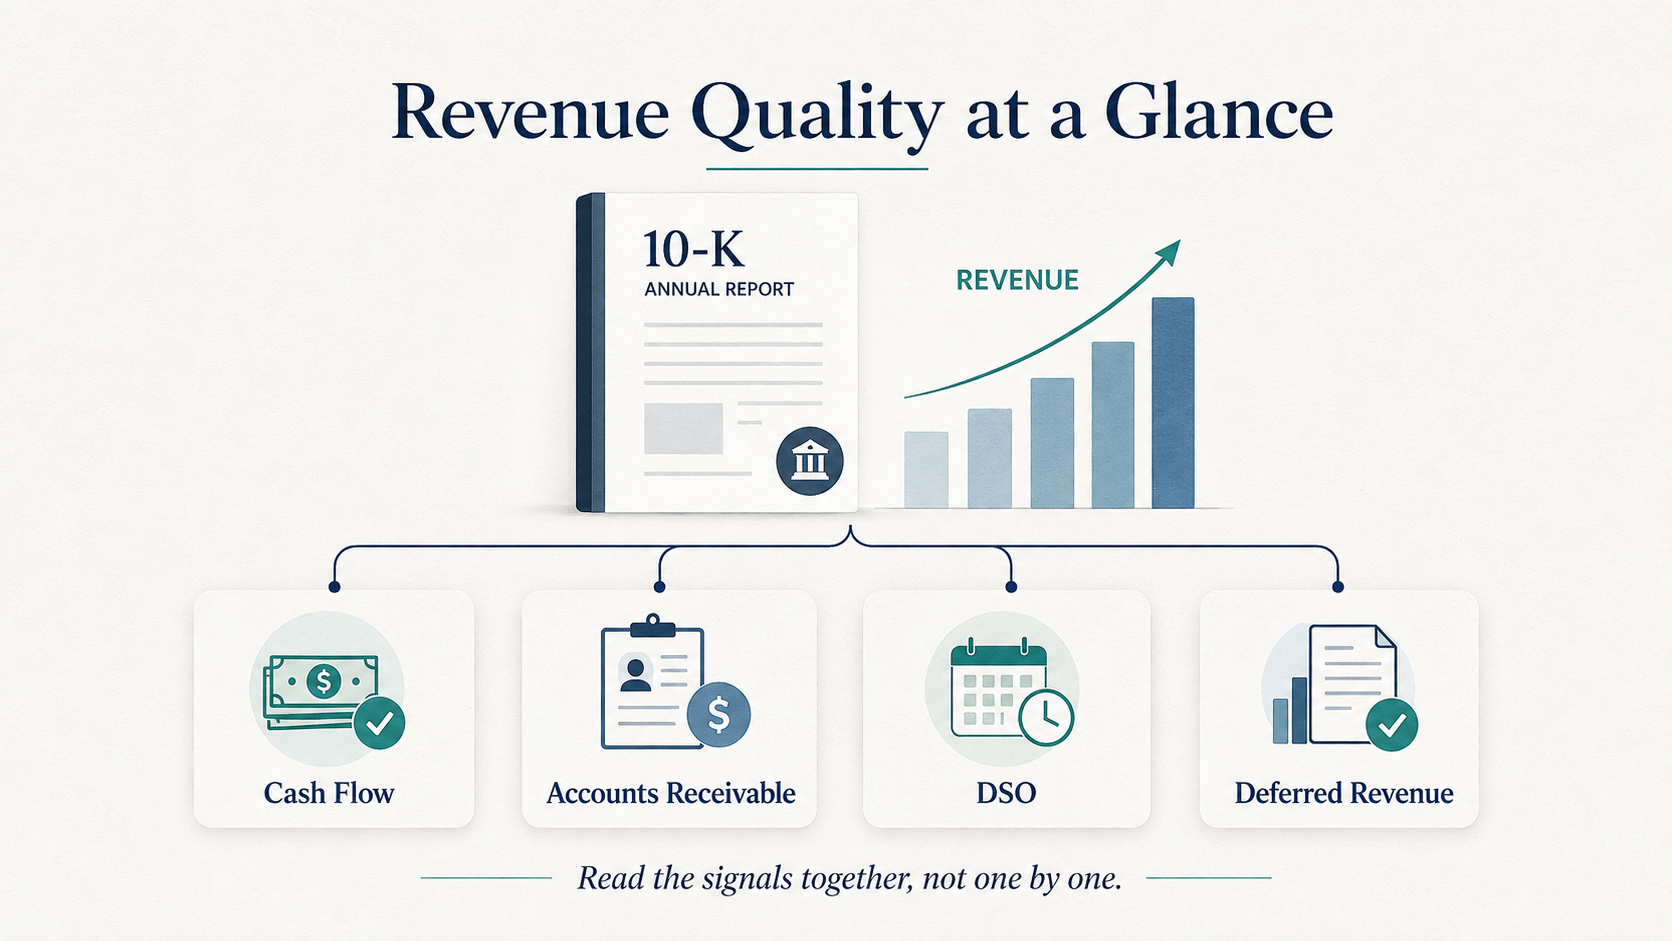
Revenue growth quality is strongest when cash flow, receivables, collection time, deferred revenue, and credit-loss estimates support the sales increase. Read them together; no single ratio proves weak accounting or predicts a stock loss.
CrowdStrike reported 22% revenue growth for fiscal 2026. Operating Cash Flow (OCF) grew more slowly, while collection time rose by about three days. That mix is not proof of weak accounting, but it is enough to stop trusting the headline and open the filing.
A Real Revenue Growth Quality Check
The rest of CrowdStrike’s fiscal 2026 filing makes the headline more useful. Revenue reached $4.812 billion for the year ended January 31, 2026, up from $3.954 billion. The surrounding accounts show whether cash collection and customer billings moved in step with the top line. Accounts Receivable (AR) tracks billed amounts not yet collected, while deferred revenue records billings or cash tied to service not yet recognized as revenue. The table also uses Days Sales Outstanding (DSO), based on average net AR, as a rough measure of collection time.
| Metric | Fiscal 2025 | Fiscal 2026 | Calculated Change | What It Says |
|---|---|---|---|---|
| Revenue | $3.954B | $4.812B | +21.7% | Strong reported revenue growth |
| Operating cash flow | $1.382B | $1.612B | +16.7% | Positive growth, but about 5 points slower than revenue |
| Accounts receivable, net | $1.129B | $1.362B | +20.7% | Slightly slower than revenue, which is generally supportive |
| Average-AR DSO | 91.5 days | 94.5 days | +3.0 days | Collections took modestly longer on this approximation |
| Deferred revenue | $3.729B | $4.753B | +27.5% | Advance billings grew faster than recognized revenue |
| Allowance / gross AR | 0.25% | 0.22% | -0.03 points | Little change; too small to treat as a stand-alone warning |
The result is mixed but mostly supportive. Receivables grew slightly slower than revenue, while deferred revenue grew much faster. Both fit a subscription business that bills customers before all related revenue is recognized. OCF still rose, although it did not keep pace with revenue, and DSO increased by about three days.
Those two annual watch items did not, by themselves, show aggressive accounting or predict a stock-price decline. CrowdStrike also says invoice terms are usually 30 to 60 days and describes its collection history as well established. Business model and billing cadence matter.
CrowdStrike's next reported quarter gave an early follow-up. In Q1 fiscal 2027, revenue rose 26% year over year while OCF rose about 54%. Deferred revenue at April 30, 2026 was about 25% above the year-earlier balance. That makes the annual cash conversion picture stronger, but the DSO watch item remains because CrowdStrike says seasonal patterns also affect when operating cash arrives.
Plain English
The annual filing cannot produce a simple pass or fail. Sales growth had meaningful cash and contract support, and the next quarter improved the cash conversion signal. Collection speed still belongs on the watchlist rather than in the red-flag column.
Readers who want to trace the cash side in more detail can use the same line-by-line approach in our cash flow statement analysis. For margin and operating cost context, see the companion income statement analysis.
What the Accrual Studies Actually Show
Richard Sloan’s 1996 study split earnings into cash and accrual components. His sample included 40,679 firm-years from 1962 through 1991. Stocks were ranked into accrual deciles, and the first-year abnormal return on a portfolio that was long the lowest-accrual decile and short the highest-accrual decile was 10.4%.
Richardson, Sloan, Soliman, and Tuna used a broader accrual measure and ranked its parts by reliability. Their sample covered 108,617 firm-years from 1962 through 2001. Table 10 reports an 18.0% next-year hedge return for the change in net operating assets, after adjusting returns for firm size.
That academic result is a portfolio spread, not a single-stock haircut. It compares two extreme decile portfolios after annual ranking. It cannot tell you the odds of disappointment or the size of a drop in one stock, and it cannot support a 30-year portfolio-loss projection.
The point is narrower. Firms with high, less reliable accruals have, on average, shown less persistent earnings and weaker later returns than firms with low accruals. The studies do not set a target price for one company.
For investors, the research works best as a screen. It tells you what to check before trusting a headline. The filing must still show whether one company’s AR, cash generation, advance billings, and estimates are becoming more or less convincing.
Five Checks to Run in a 10-K
1. Compare Revenue Growth With Operating Cash Flow Growth
Revenue is recognized under accrual accounting. OCF shows the cash effects of operations after working capital changes and noncash items. Cash can lag for normal timing reasons, but a gap that widens for several periods needs an explanation.
Start with the annual cash flow statement rather than a quarterly press release. Then read the working capital discussion. OCF may grow more slowly because receivables rose, deferred commissions increased, or customers paid on a different schedule. The cause matters more than a fixed threshold.
2. Compare Accounts Receivable Growth With Revenue Growth
AR records amounts the company has billed and has an unconditional right to collect. In a subscription business, AR does not map one-for-one to recognized revenue because some billings can also be recorded as deferred revenue. When net AR keeps growing faster than revenue, ask whether billing, collection, deferred revenue, and OCF still tell a consistent story.
One annual increase is not proof of poor quality. Acquisitions, seasonal billing, channel mix, and invoice timing can all move the balance. Compare at least two periods and use the notes to spot changes in payment terms or customer concentration.
3. Calculate Days Sales Outstanding Consistently
DSO turns AR into a rough measure of collection time. For an annual check, a cleaner formula uses average net AR:
DSO = Average Net Accounts Receivable / Annual Revenue × 365
Use the same method every year. That keeps the year-to-year trend on the same measurement basis. A rising value means cash is taking longer to arrive relative to sales, but it still needs context. Annual DSO can be distorted by seasonal billing, acquisitions, and the timing of large invoices near year-end.
4. Read Deferred Revenue as a Business-Model Signal
Deferred revenue records cash received or amounts billed before the company has provided the related service. In many subscription businesses, a rising balance can support the broader growth story because it reflects future service already billed or paid for, even when the multiple paid for it falls sharply.
It is not always bullish. Contract length, cancellation rights, billing schedules, and revenue-recognition rules shape what the balance means. Direction alone is not enough, so read the contract-balances footnote rather than treating any increase as proof.
5. Check the Allowance for Credit Losses
The allowance reduces gross AR for amounts management believes may go uncollected. Compare the allowance with gross AR, then read the policy note. A falling ratio while AR and DSO rise can justify more questions, especially if write-offs or customer risk are increasing.
Do not overread small changes. The allowance is an estimate, and a normal level varies by customer base. Ask whether the estimate, collection record, and AR trend fit the same story.
| Check | Supportive Pattern | Watch Pattern | Investigate Further |
|---|---|---|---|
| Revenue vs. OCF | Cash flow broadly keeps pace over time | One-period gap with a clear timing explanation | Persistent gap with weak disclosure |
| AR vs. revenue | AR grows no faster than sales | Temporary divergence | AR repeatedly outgrows sales |
| DSO | Stable within the business cycle | Modest increase | Persistent increase alongside weaker cash conversion |
| Deferred revenue | Direction fits billing and contract terms | Growth slows with a documented cause | Balance weakens while recognized growth stays high and explanations are thin |
| Allowance | Estimate fits collection history | Small movement without other warning signs | Ratio falls while AR, DSO, and credit risk rise |
Download the worksheet: Use the Revenue Growth Quality 10-K Checklist (PDF) to record revenue growth, OCF growth, AR growth, DSO, deferred revenue, and the allowance ratio each time you review a filing.
How to Read Mixed Signals Without Overreacting
Most real filings will not line up perfectly. A useful process separates three outcomes.
Support: Cash generation broadly matches top-line growth, AR stays in line with sales, DSO is stable, and advance-billing balances fit the business model. That supports the growth story, while valuation and competitive risk remain separate questions.
Monitor: One or two signals weaken, but the filing gives a reasonable timing or business-model reason. Record the metric and compare it with the next filing. CrowdStrike’s fiscal 2026 mix of slower OCF growth and a modest DSO increase fit this middle category. Q1 fiscal 2027 then improved the cash conversion signal, but the annual DSO increase still deserves follow-up.
Investigate: AR and DSO rise together, OCF keeps lagging sales, the allowance ratio falls as credit risk rises, and the filing gives no clear reason. At that point, read customer concentration, revenue-recognition rules, acquisitions, and later filings before adding to the position.
This is where broader solvency checks also matter. Our guide to predicting company bankruptcy explains why cash strain, leverage, and refinancing risk cannot be inferred from top-line growth alone.
Keep a one-page filing log. Record sales growth, OCF growth, AR growth, DSO, contract-balance growth, and the allowance ratio for each annual report. The trend is usually more informative than any single year’s label.
Revenue Growth Quality FAQ
Does high revenue growth mean the revenue is high quality?
No. The growth rate shows how fast recognized sales rose. Quality depends on whether cash collection, AR, advance billings, and estimates support that growth. A high rate can be well supported, poorly supported, or mixed for a time.
Is rising AR always a warning sign?
No. Receivables often rise when a company grows. Compare AR growth with sales growth, then check DSO, payment terms, customer concentration, and OCF. Concern rises when several measures deteriorate together.
Does the accrual anomaly predict a fixed stock loss?
No. Richardson and coauthors reported a next-year return spread after adjusting for firm size. The test went long low-accrual firms and short an equal portfolio of high-accrual firms. That was a historical decile-portfolio result, not an expected loss for one company.
How many years should I compare?
Use at least two annual periods, and preferably three when the business is highly seasonal or acquisition-heavy. A longer series helps separate normal billing shifts from a lasting decline in cash conversion or collection quality.
The Bottom Line on Revenue Growth Quality
Revenue growth matters, but it should not end the review. Read revenue alongside OCF, AR, collection time, advance billings, and credit-loss estimates.
Sloan and Richardson show why accrual quality matters across many firms. The 10-K gives the evidence for one company. Keeping those roles separate stops a portfolio result from becoming a forecast for one stock.
For CrowdStrike’s fiscal 2026 filing, the balance is mostly supportive with one item to monitor. Revenue and AR grew at similar rates, deferred revenue grew faster, and OCF remained strong. Q1 fiscal 2027 then showed faster year-over-year OCF growth than the top line. The roughly three-day annual DSO increase is still worth tracking, but the evidence cannot justify turning an accrual screen into a price target for one company.
YOUR TURN
In the latest 10-K you read, which grew fastest: revenue, OCF, AR, or deferred revenue?
- CrowdStrike Holdings, Inc., fiscal 2026 and fiscal 2025 Form 10-Ks: Revenue, operating cash flow, accounts receivable, deferred revenue, allowance, payment terms, contract-balance disclosures, and the January 31, 2024 receivable balance needed to reproduce fiscal 2025 average-AR DSO. Fiscal 2026 filing · Fiscal 2025 filing.
- CrowdStrike Holdings, Inc., Q1 fiscal 2027 Form 10-Q: April 30, 2026 revenue, operating cash flow, deferred revenue, and seasonality disclosure used for the follow-up check. SEC filing.
- Sloan (1996), The Accounting Review 71(3): 40,679 firm-years from 1962 to 1991; first-year 10.4% long-low, short-high accrual hedge return. Paper record.
- Richardson, Sloan, Soliman, and Tuna (2005), Journal of Accounting and Economics 39(3): 108,617 firm-years from 1962 to 2001; 18.0% next-year size-adjusted hedge return for the change in net operating assets. Paper record.
- Calculation method: Growth equals current-year value divided by prior-year value minus one. DSO equals average net AR divided by annual revenue times 365. The allowance ratio equals allowance divided by estimated gross AR. Figures are rounded, and DSO is an analytical approximation rather than a company-reported KPI.
- Limits: This screen is designed for nonfinancial public companies with at least two comparable annual periods. Banks, insurers, and early-stage companies need different measures. It does not establish fraud, prove earnings management, or forecast a stock return. Industry economics, acquisitions, seasonality, billing terms, and accounting policy can change the interpretation.
AI tools assisted with source organization and arithmetic checks. Danny Hwang reviewed the primary filings, calculations, reasoning, and final wording before publication.
Update History
- V2.2August 15, 2026Enhancement
Added a reader-friendly explanatory image and a downloadable PDF checklist to make the five-step revenue-quality process easier to use during 10-K reviews.
- V2.1August 14, 2026Refresh
Clarified how accounts receivable and deferred revenue interact in a subscription model, completed the DSO source chain with the fiscal 2025 filing, added the Q1 fiscal 2027 follow-up, normalized internal links, and updated current component markup.
- V2.0July 17, 2026Correction
Removed the unsupported $109,616 portfolio-loss calculation and corrected the academic hedge-return figure to its actual meaning: a historical long-short decile portfolio return. Rebuilt the company example from CrowdStrike’s fiscal 2026 Form 10-K.
- V1.0April 13, 2026Published
Original version published.