Wealth FoundationsBuild the System Before You Pick the Assets
Long-term wealth is usually won or lost in the setup.
We break down investing basics, account rules, fees, taxes, allocation, and the behavioral decisions that compound for decades.
Primary Sources
Long-Term Math
Practical Decisions
The Foundation
How We Build Stronger Wealth Foundations
Good investing starts before a ticker enters the conversation. These guides focus on the account structure, costs, risk capacity, and repeatable rules that determine whether a sensible plan survives real life.
01 · Plan
What job does this money need to do?
We start with goals, time horizon, liquidity, and risk capacity so the portfolio is built around a real obligation rather than a generic return target.
02 · Friction
What quietly reduces the return?
We trace fees, taxes, account restrictions, trading costs, and default settings that look small in one year but become large over a full investing lifetime.
03 · Behavior
Can the plan survive a bad market?
We favor rules that remain usable during volatility, when a mathematically sound portfolio is most likely to be abandoned or changed at the wrong time.
Educational guides for building an investing system, not personalized investment, tax, or legal advice.
Research Library
Latest Wealth Foundations Guides
Investing basics, account strategy, portfolio construction, fees, taxes, and long-term decision rules.
Apr 27, 2026
$240B Lost: 4 CEO Red Flags Investors Miss
Acquiring-firm shareholders lost 12 cents per dollar deployed across the 1998-2001 merger wave, totaling $240 billion in destroyed wealth per Moeller, Schlingemann, and Stulz (2005).
Read the analysis →Apr 9, 2026
$68,195 Portfolio Rebalancing Strategy: One Change.
Monthly calendar rebalancing costs $68,195 more than a 5% threshold strategy over 30 years. One account setting drives the entire gap.
Read the analysis →Apr 8, 2026
$334,814 Expense Ratio Impact: The Fee Nobody Shows You
1% expense ratio = $750/yr on a $75K balance (ICI 2026). 0.03% index fund = $22.50/yr for identical market exposure. The 30-year compound gap: $334,814.
Read the analysis →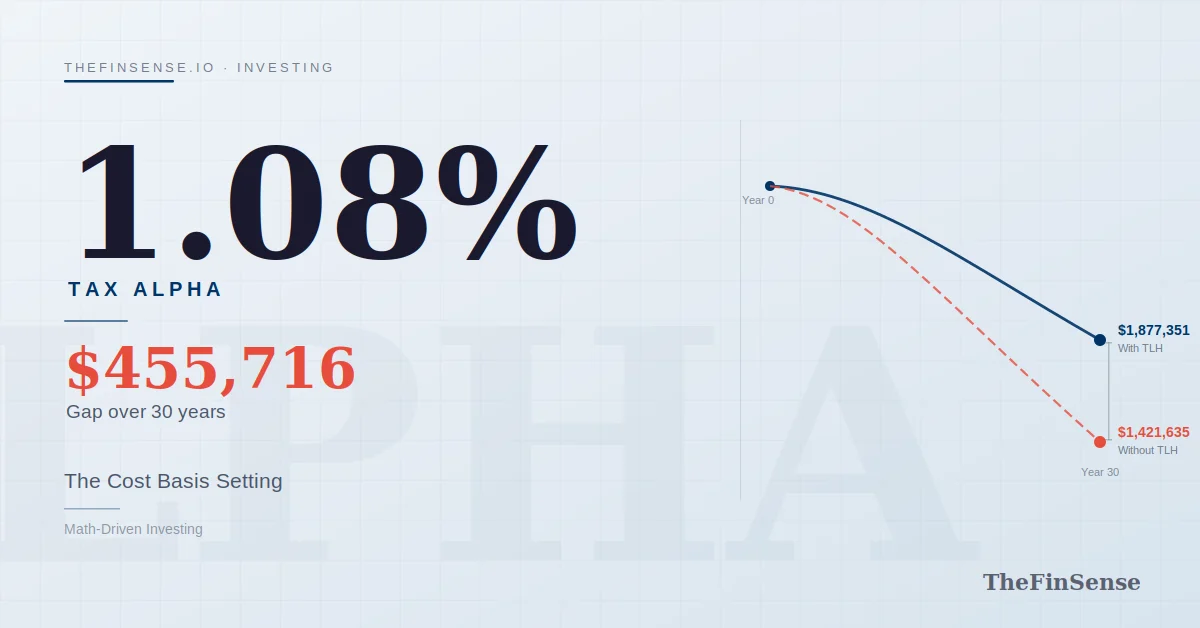
Apr 5, 2026
$455,716 Tax Loss Harvesting Rules: 30-Day Clock
Tax loss harvesting rules produce 1.08% annualized tax alpha, not a $720 annual deduction. That alpha compounds into a $455,716 gap over 30 years.
Read the analysis →
Apr 2, 2026
Mega Backdoor Roth: Your 401(k) Plan Is the Real Gatekeeper
The IRS permits $72,000 in total 401(k) contributions under §415(c), but 78% of employer plans block the $42,100 after-tax capacity that makes the mega backdoor Roth possible.
Read the analysis →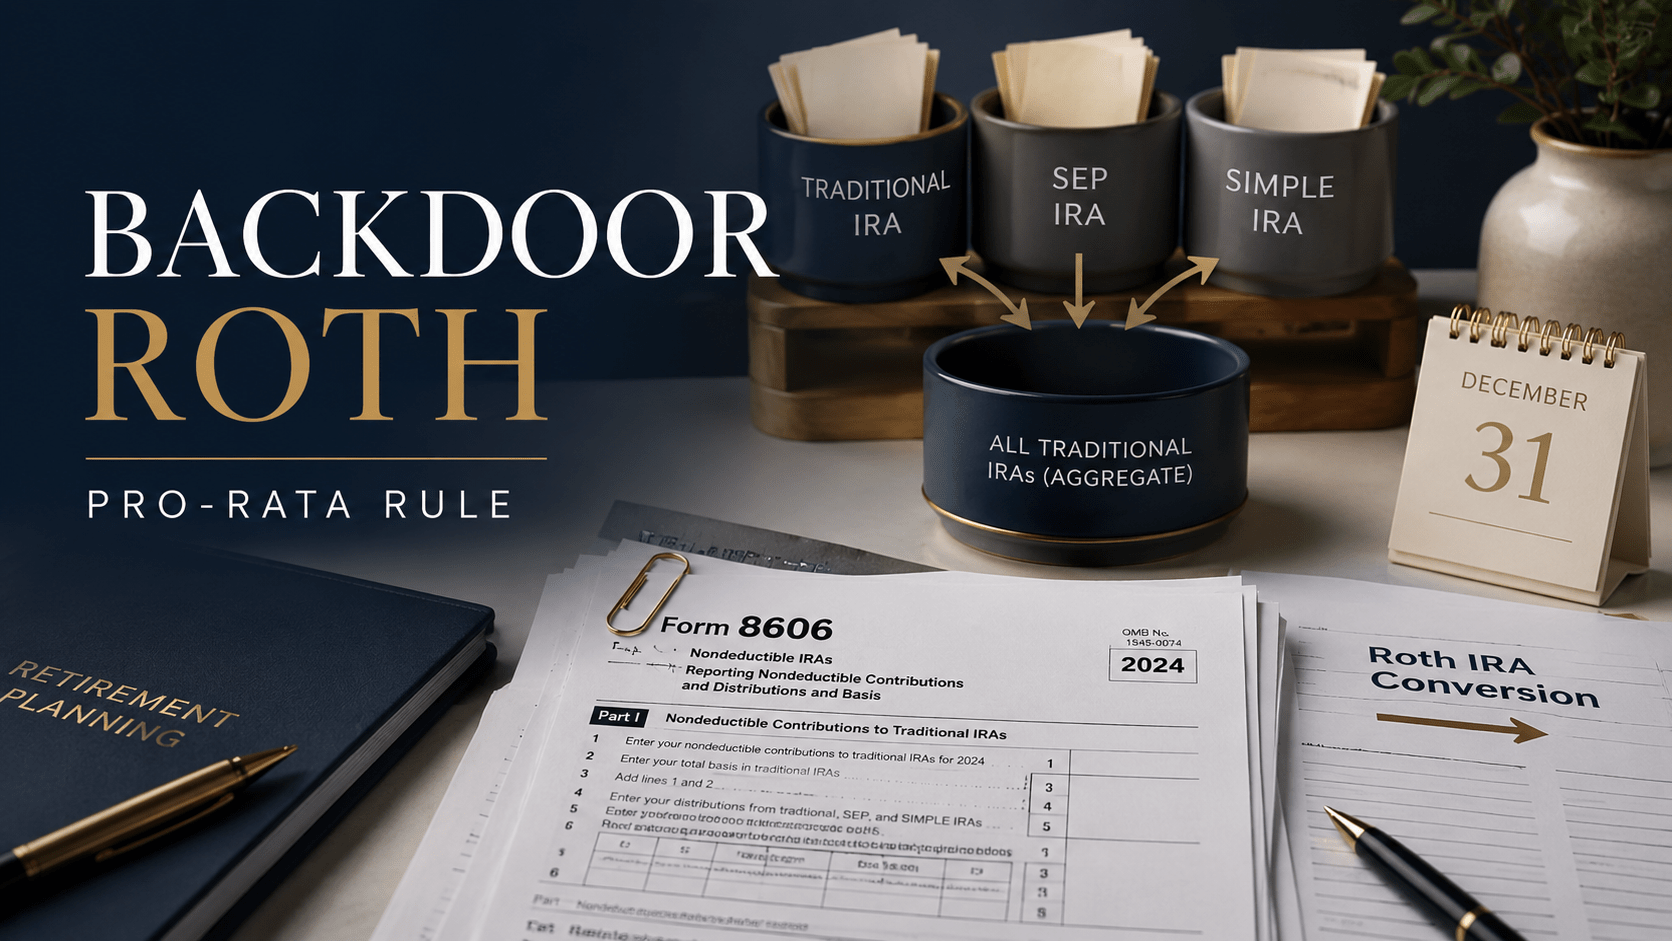
Apr 1, 2026
Backdoor Roth IRA Rules: The Pro-Rata Trap Before You Convert
A backdoor Roth is not automatically tax-free. Learn how Form 8606 pools Traditional, SEP, and SIMPLE IRAs, how a rollover IRA changes the taxable share, and what to check before…
Read the analysis →
Mar 31, 2026
Overfunded 529 Plan: The 10% Exit Trap Most Parents Miss
Use a decision-first framework to compare qualified expenses, Roth rollovers, beneficiary changes, federal exceptions, and a taxable withdrawal from an overfunded 529 plan.
Read the analysis →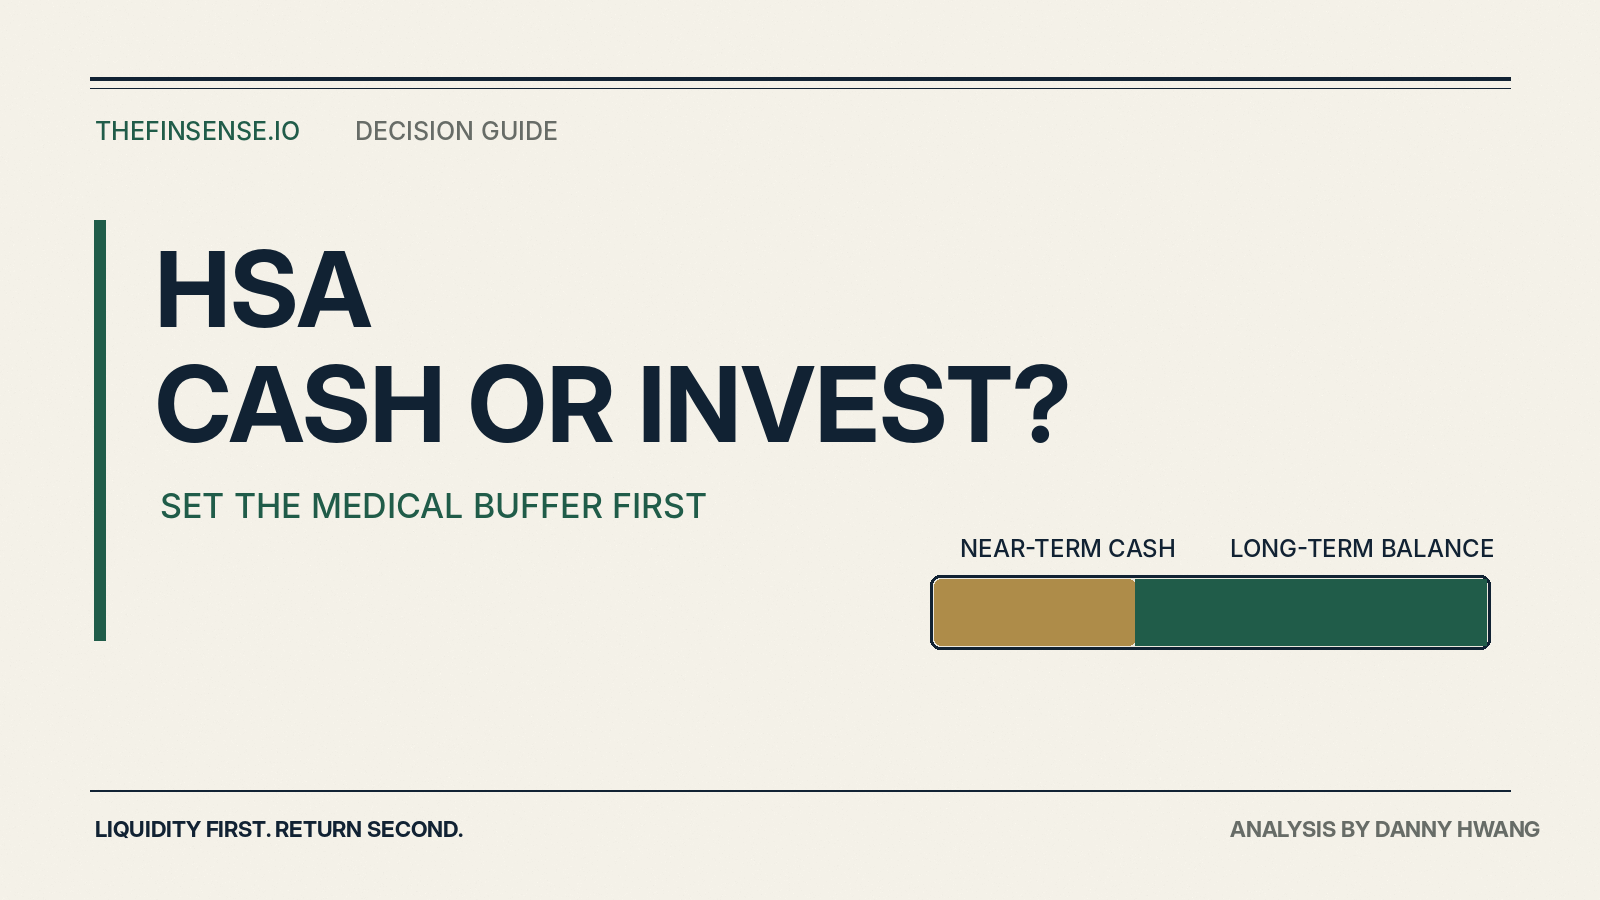
Mar 29, 2026
HSA Investment Strategy: How Much Cash Should You Keep Before Investing?
A practical HSA investment strategy starts with a cash target, then invests only the balance that can stay untouched through a market decline.
Read the analysis →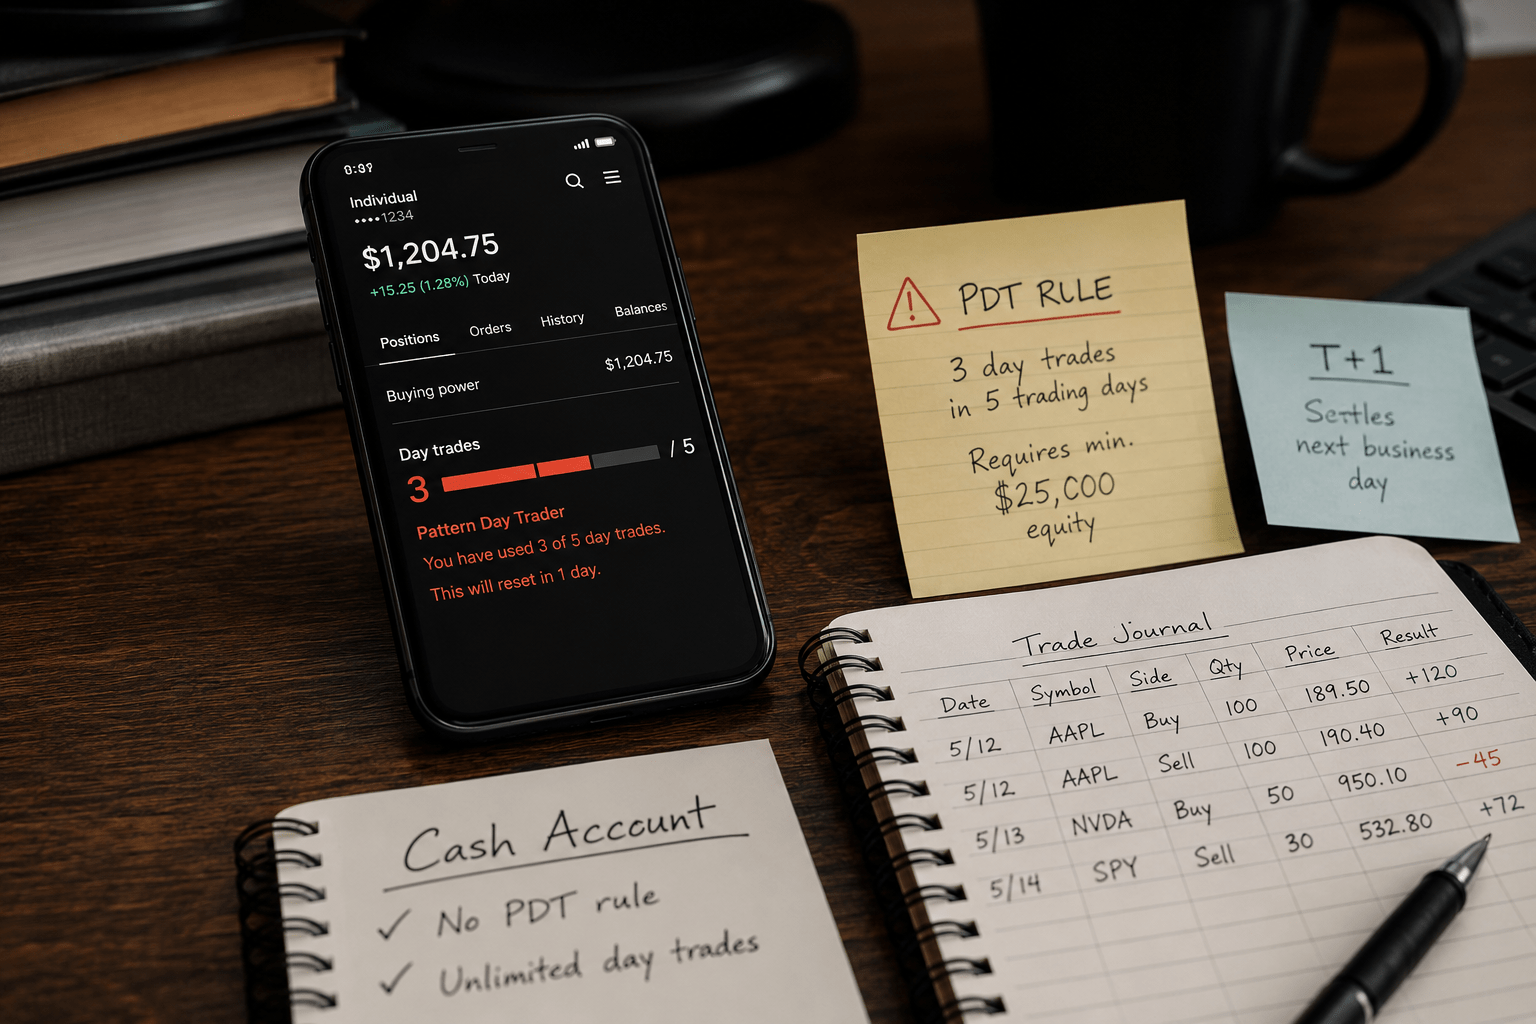
Mar 27, 2026
Pattern Day Trader Rule: What Changed and What Still Applies
Reg T margin: $30K buying power on $15K equity. Cash account: $15K. The 50% gap compounds to $19,725 over 10 years.
Read the analysis →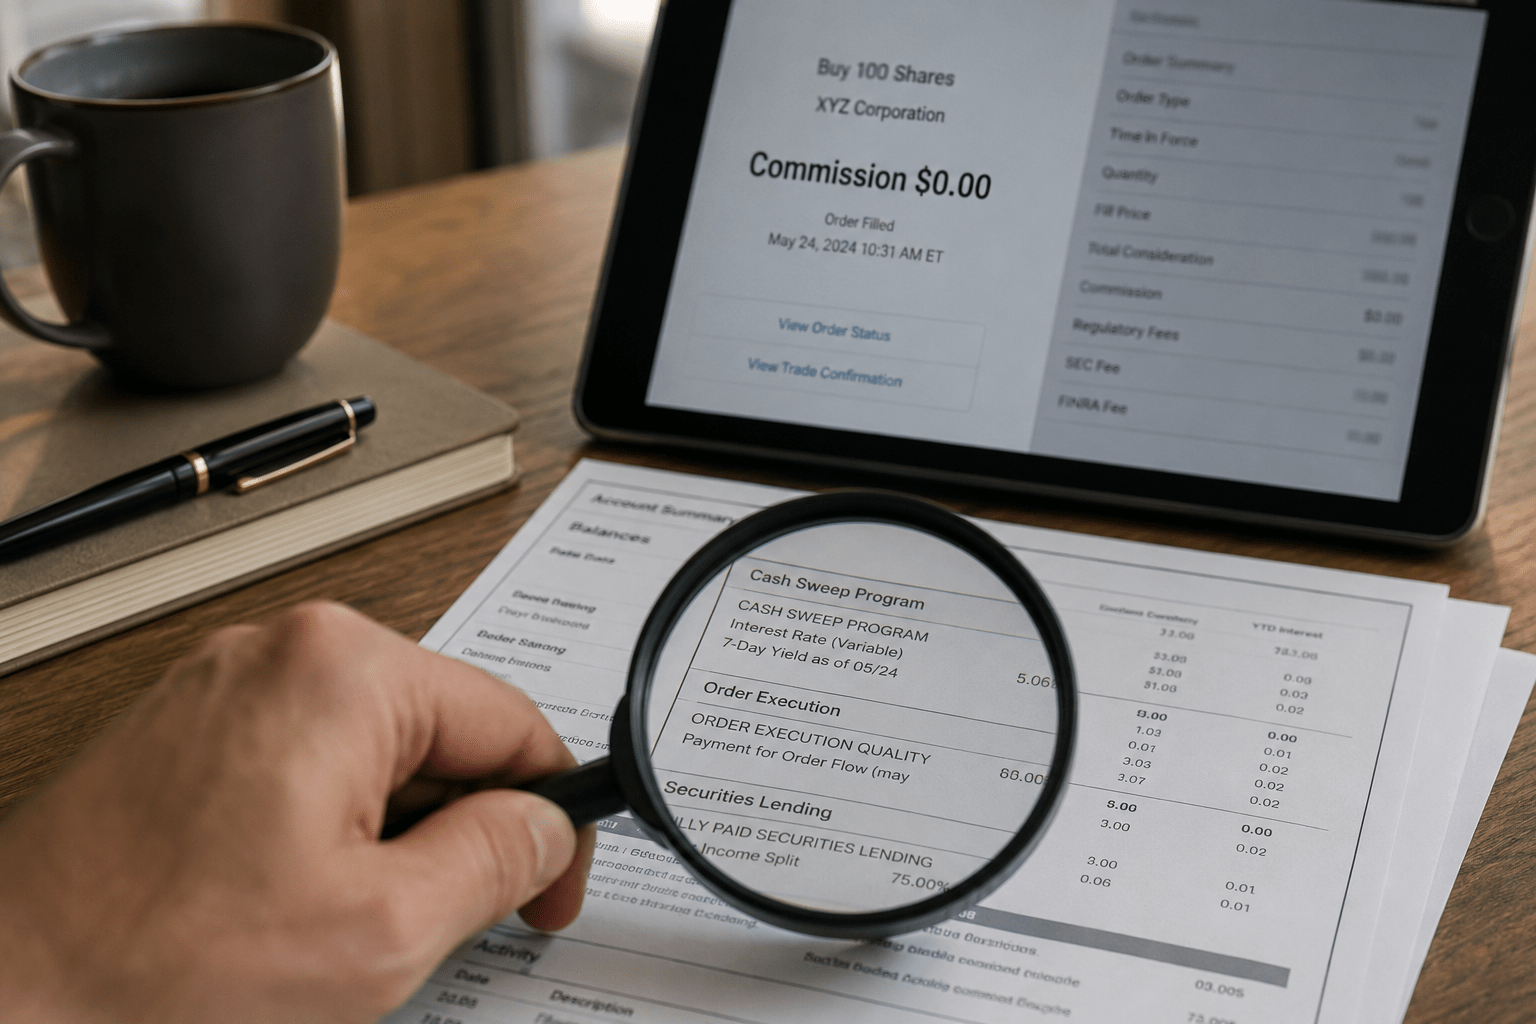
Mar 26, 2026
Zero-Commission Brokers Aren’t Free: The Costs Your Trade Ticket Misses
Your broker says $0 commission. Researchers spent $23,000 placing 85,000 identical trades and found the real cost: up to 0.46% per trade. Three hidden layers compound to $223,908 over 30…
Read the analysis →