
Updated: · Dated example and source context
Need date first: Keep immediately needed cash accessible. Compare after-tax returns only among products that can meet the same deadline.
Enter the cash you must keep available now →
Run the Same Decision With Your Own Cash
The calculator keeps the immediate-access layer separate first, then compares only the cash that is actually available for the rate-and-tax decision.
Cash Reserve & After-Tax Comparison
Keep the cash you may need now out of the yield contest. Then compare the remainder over the same holding period.
The comparison will appear here.
Run the comparison to see how access, tax, and rates change the result.
A $50,000 Cash Reserve Is Really Four Decisions
July 2026 California example: dates, taxes and the $6.36 difference
📅 Originally Published: · Comparison last reviewed: · The worked HYSA, Treasury bill, and CPI comparison preserves a July 11, 2026 decision snapshot; fund yields and bond terms are separately dated.
Answer first: To protect savings from inflation without creating a liquidity problem, stop treating the whole cash reserve as one yield decision. Split it by the earliest date each layer may be needed, then compare only the choices that can meet that deadline. In the July 11, 2026 California example, a four-week Treasury bill leaves about $6.36 more after tax than the illustrative savings account on the same $50,000 starting balance. That small edge is useful evidence, but not a reason to lock up money that may be needed sooner. Both choices still trail the CPI-U reading available on the comparison date after tax.
A California saver has $50,000 in cash and sees a bank APY that is higher than the annualized investment rate on a 4-week Treasury bill. The bank appears to win. Over the bill’s actual term, the state-tax exemption narrowly flips the after-tax result.
Using the Treasury auction price of 99.719611 per $100 of face value, that starting balance earns about $140.59 before tax over the bill’s 28-day term. After the federal tax assumption, the amount left is about $106.85. A savings account in the 4.00% model earns about $150.66 before tax over the same period, but only $100.49 after the modeled 24% federal and 9.3% California taxes. The bill’s advantage is about $6.36 for that holding period. Retail Treasury purchases use $100 increments, so the dollar figures are a proportional comparison rather than an order-ticket quote.
There is a second reality check. The Bureau of Labor Statistics reported that CPI-U was up 4.2% over the 12 months ending May 2026, the latest release available on July 11. At that inflation rate, both choices lose purchasing power after tax. Cash can still be the right holding for an emergency fund, but anyone trying to protect savings from inflation has to separate immediate access from long-term purchasing-power protection.
The same household can reasonably use several cash products at once because money needed tonight has a different job from money that can wait four weeks or twelve months. The comparison below therefore uses individually dated inputs and treats each product as a possible layer, not a universal replacement for the others. The 4.00% HYSA is illustrative. The Treasury input comes from the July 2, 2026 auction of a 4-week bill. Vanguard’s VUSXX figure is separately dated July 23. The I Bond rate applies to bonds issued from May through October 2026.
| Cash Option | Dated Input | Four-Week After-Tax Interest on $50,000 | One-Year Real-Return Model | Best Fit |
|---|---|---|---|---|
| Illustrative HYSA | 4.00% illustrative annual input | $100.49 | About −1.47% at 4.2% CPI | Money needed immediately |
| 4-Week Treasury Bill | 99.719611 price; 3.665% investment rate | $106.85 | About −1.31% only under constant-price, full-proceeds reinvestment | Cash that can wait for a maturity date |
| VUSXX Treasury Money Market Fund | Separately dated VUSXX figure; not modeled | Not modeled | Not modeled because the fund payout and state-exempt share can change | Brokerage cash with frequent access |
| I Bond | 4.26% composite rate | Not available during the first 12 months | Not directly comparable because federal tax is usually deferred | Reserves that will not be needed for at least a year |
Use the table to route each layer by need date before comparing returns. Compare after-tax yield only among choices that can meet the same deadline. A bank account can still be the better home for the first layer even when its after-tax rate is lower. An emergency that happens tonight does not wait for a Treasury maturity or a brokerage transfer. If available cash falls short and you are considering retirement money, compare the same cash need from a 401(k) loan or withdrawal, including the payment your budget would have to support.
The FDIC national rate table for June 15, 2026 is a reminder to check old savings accounts that have quietly fallen behind. Moving from a legacy savings account to a competitive cash option usually matters more than squeezing the last few basis points from two already competitive choices. If the narrower question is how to put HYSA, money-market-fund, and T-bill quotes on the same horizon, use the separate HYSA vs. money market fund comparison. Here, the first question comes earlier: can that layer of cash wait long enough to enter the product comparison at all?
Why the Highest APY Can Still Be the Wrong Choice
Once two options pass the same access test, the useful comparison is what remains after tax and inflation, not the largest percentage printed on the product page. The shortcut of subtracting tax and inflation is fine for a rough screen. The exact calculation treats inflation as a change in the price level.
Exact after-tax real return = (1 + nominal yield × (1 − applicable marginal tax rate)) ÷ (1 + inflation rate) − 1. Use the same inflation benchmark for every option in the comparison.
For the HYSA example, the simplified combined marginal rate is 33.3%. The account earns 2.668% after tax in the model. Dividing that result by a 4.2% rise in the price level produces an after-tax real return of about −1.47%.
The Treasury investment rate is an annualized coupon-equivalent yield, not the return paid by one four-week bill. Starting from the auction price, the holding-period return is about 0.2812%. If that price repeated every four weeks and all proceeds were reinvested, the effective annual gross return would be about 3.7280%. After the modeled 24% federal tax, the nominal return becomes about 2.8333%, which produces an after-tax real return of roughly −1.31% against 4.2% CPI.
The break-even HYSA APY uses the Treasury bill’s effective annual return, not its coupon-equivalent investment rate. Treasury effective annual return = (100 ÷ auction price)365 ÷ days to maturity − 1.
Break-even HYSA APY = Treasury effective annual return × (1 − federal rate) ÷ (1 − federal rate − state rate). With the July 2 price and the stated tax brackets, the HYSA needs to pay about 4.25% to match the constant-price, full-reinvestment Treasury model after tax.
That threshold moves whenever the auction price or either tax rate changes. In a state with no personal income tax, both products face the same simplified federal tax assumption. In that case, the 4.00% HYSA model input beats the Treasury model’s 3.7280% effective annual return. Taxes can reverse a close ranking, but only after both choices have already passed the same access test.
For a broader discussion of the inflation measures behind this calculation, see CPI vs. PCE. Your personal cost of living will not match national CPI exactly, but using one consistent benchmark keeps the product comparison honest.
The Money You May Need This Week Has a Different Job
Keep enough money for the next few days in an insured bank account before trying to optimize the rest of the reserve. Rent, medical costs, travel, and urgent repairs can arrive before a security matures or a brokerage transfer settles. That immediate availability has value even though it does not appear in the APY.
For many households, one month of essential spending is a reasonable starting layer. Someone with unstable income, a high insurance deductible, or a single source of household earnings may want more. The amount should come from the consequences of being short on cash, not from a generic rule.
Bank deposits also have a protection structure that a money market mutual fund does not. Eligible deposits are insured by the FDIC up to the applicable limits. A Treasury money market fund is a security, not a bank deposit, and is not FDIC insured. It is designed to keep its net asset value at $1 per share, but that stability is not the same legal guarantee.
Check the account mechanics before moving cash. Withdrawal limits, external-transfer holds, wire fees, and whether the quoted APY requires direct deposit can matter more than a small rate difference. The same issue appears in brokerage cash programs. Review brokerage sweep account rates rather than assuming idle cash earns the fund yield shown elsewhere on the site.
Use Maturity Dates, Not Product Labels, for the Next Layer
If part of the reserve has a known window and does not need same-day access, a short Treasury ladder can turn that timing into a schedule. One simple four-rung version buys equal 4-week bills one week apart. After the first month, one rung matures each week; if the money is still not needed, the proceeds can buy another 4-week bill.
Holding a bill to maturity avoids having to accept a secondary-market price. Selling early is possible in a brokerage account, but the sale price can be above or below what you paid. The shorter the remaining maturity, the smaller that rate sensitivity usually is, yet it is still a real difference from a bank balance.
The Friction Is Usually Operational, Not Mathematical
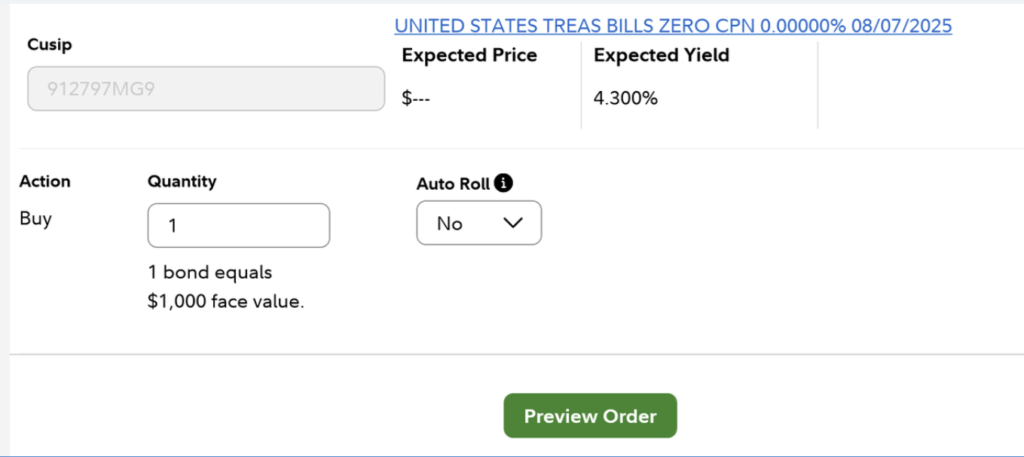
When I first built a short Treasury ladder in 2022, the arithmetic took minutes. Most of the attention went to the order screen, reinvestment election, and the cash position that would receive proceeds if a roll failed. That is still the part worth double-checking: a ladder works only if the maturity schedule and the account mechanics match the dates when the cash might be needed.
The official reinvestment rules reinforce that distinction. TreasuryDirect allows up to 25 scheduled reinvestments for a 4-week bill and keeps the same term, while the next auction determines the new price. Fidelity’s Auto Roll service also uses the same face value and term but states that interest payments are not included in the next purchase. Neither mechanism should be confused with the article’s constant-price, full-proceeds one-year model.
Brokerage Cash Can Trade Some Yield for Easier Access
For cash already held at a brokerage, a Treasury money market fund can sit between bank cash and a bill ladder. Vanguard’s money-market comparison provided a separately dated VUSXX 7-day SEC yield as of July 23, 2026. It is an annualized snapshot of recent fund income, not a guaranteed one-year return, so it is excluded from this article’s holding-period dollar comparison.
Fund names can also be misleading. A “government” money market fund may hold agency securities or repurchase agreements whose income does not receive the same state treatment as direct Treasury obligations. The state-exempt share must be checked in the fund’s year-end tax supplement for the relevant tax year. A prior-year percentage should not be carried forward as a promise.
Readers comparing other short-duration choices can use the same logic in How Bonds Work. Check where the return comes from, when the money becomes available, and what happens if the position must be sold early.
I Bonds Belong Only in the 12-Month-Plus Layer
I Bonds belong only in the part of a reserve that will not be needed for at least 12 months. They cannot be redeemed during the first year, and a redemption before five years gives up the previous three months of interest. That makes a newly purchased I Bond a poor home for rent money or the only emergency reserve, even when its inflation linkage looks attractive.
For bonds issued from May through October 2026, Treasury set a 4.26% composite rate. That rate combines a 0.90% fixed rate with a 3.34% annualized inflation component and applies for the bond’s first six months. The fixed rate stays with the bond, while the inflation component changes every six months according to the bond’s issue-month schedule.
The federal tax treatment is different from a HYSA or Treasury bill. Most cash-method taxpayers can defer federal tax on I Bond interest until redemption, maturity, or another taxable disposition, unless they choose annual reporting. State and local governments do not tax the interest. That deferral makes a one-year “after-tax yield” comparison misleading because the tax has not yet been paid.
The 12-Month Lock Matters More Than Guessing the Next Reset
Treasury sets new I Bond rates in May and November. Investors can estimate the next inflation component after the relevant CPI data are released, but the new fixed rate is not official until Treasury announces it. Purchase timing can matter near a reset, but it is a second-order issue. The first question is whether this layer of cash can stay untouched for at least a year.
The annual electronic purchase limit is $10,000 per owner per calendar year. A married couple using separate accounts can each buy up to that limit. The purchase cap does not make I Bonds a complete emergency-fund solution, but it can be useful for a reserve layer that has already passed the 12-month lock.
If your main question is which low-volatility product to choose rather than how to layer one cash reserve by need date, see safe investments to beat inflation. Use that guide after the need date is set. Here, the decision is how much cash should reach each time horizon before product selection begins.
Questions That Can Change the Cash-Layer Decision
Can a HYSA protect savings from inflation?
A HYSA can slow the loss of purchasing power, but a positive APY does not guarantee a positive real return. In the July 11, 2026 example, the modeled HYSA leaves about 2.668% after federal and California taxes. Against the CPI-U reading available on that date, the exact after-tax real return is roughly −1.47%. A saver in a zero-income-tax state would keep more.
Are Treasury bills safer than a savings account?
Treasury bills and savings accounts use different protection structures: bills are direct obligations of the U.S. government. Eligible bank deposits are covered by FDIC insurance up to the applicable limits. A bill held to maturity pays its face value, while a bill sold early can gain or lose value in the market. A savings account usually offers easier access and no market sale.
What HYSA rate matches the Treasury bill in this California example?
Under the article’s stated federal and California marginal-rate assumptions, the modeled break-even rate is about 4.25%. That figure converts the July 2 Treasury auction price into a constant-price, full-reinvestment effective annual return before applying the tax comparison. It ignores NIIT, local taxes, deductions, credits, fees, and changing future auction rates.
Can TreasuryDirect automatically reinvest a 4-week bill?
Yes. TreasuryDirect allows up to 25 scheduled reinvestments for a 4-week bill, covering as much as two years. The replacement keeps the same term, but a new auction sets its price. Broker auto-roll programs also differ in how they treat maturing principal, interest, and unmatched auctions.
Should I put my whole emergency fund in I Bonds?
No. New I Bonds cannot be redeemed for 12 months, so they should not hold money that may be needed during that period. They are more suitable for a secondary reserve after the household already has accessible cash. Even after the lock expires, redeeming before five years costs the previous three months of interest.
Build the Reserve From the Inside Out
A workable plan to protect savings from inflation does not require every dollar of cash to beat CPI every month. Start with the layer that must work on the worst possible day, then extend outward to money that can wait weeks or months. Only after each layer has a time horizon should yield and tax treatment decide among the eligible products.
| When the Money May Be Needed | Reasonable Starting Place | What to Verify |
|---|---|---|
| Today or within a few days | FDIC-insured checking or HYSA | APY conditions, transfer holds, insurance limits |
| Within days, held at a brokerage | Treasury-focused money market fund | Settlement cutoff, fund risk, year-end state-exempt percentage |
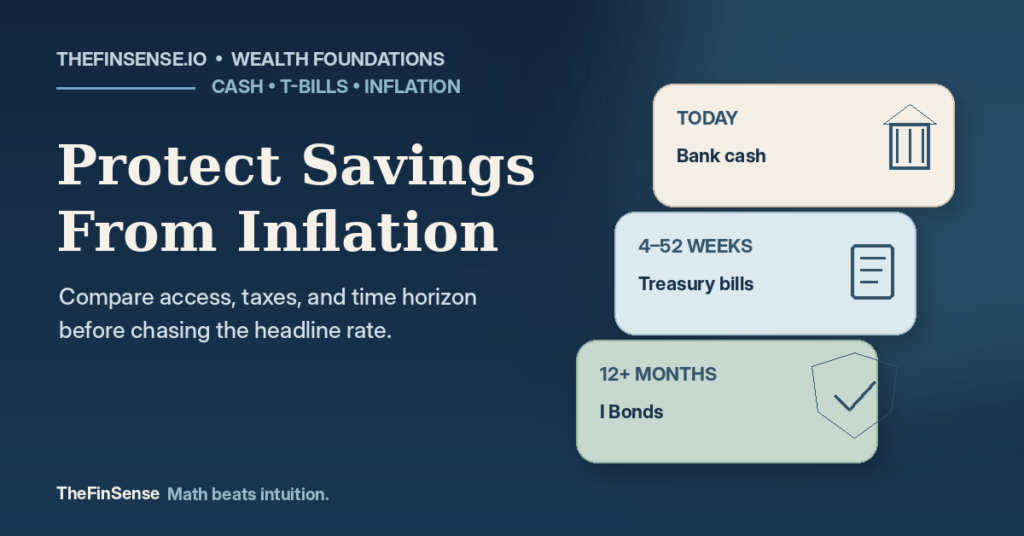
| On a planned 4-to-52-week schedule | Short Treasury bill ladder | Maturity dates, reinvestment setting, early-sale risk |
| Not needed for at least 12 months | I Bonds as an optional reserve layer | Purchase cap, lock period, early-redemption penalty |
In the July 11 California example, the Treasury bill leaves about $6.36 more after tax over its actual term on the modeled starting balance. If the same auction price repeated for a full year and every maturity dollar were reinvested, the modeled advantage would be about $82.65. Neither amount is large enough to justify leaving a household without same-day cash. Keep the immediate layer simple and apply the tax comparison only to money that can tolerate a schedule.
Recheck the numbers when rates or CPI move. The 4.25% break-even point is tied to one Treasury auction, a constant-price reinvestment assumption, and one tax example. The durable part of the framework is the order of operations: need date first, product eligibility second, taxes third, and headline yield last.
Keep reading
Three useful next steps for your cash decisions
YOUR TURN
Write down the earliest date each part of your cash reserve could be needed. That one exercise usually makes the account choice much easier.
Update History
- v1.6 2026-10-18 REVIEW UPDATE
Blocked blank required inputs and non-finite results in the cash-layer calculator, hid stale results after input changes, and replaced navigation excerpts in social descriptions. Historical Treasury, CPI, and I Bond inputs retain their stated dates.
- v1.0 2026-03-13 PUBLISH Initial publication.
- v1.1 2026-07-10 UPDATE Added dated-rate language, tax-method notes, and the trust package.
- v1.2 2026-07-11 REPAIR Rebuilt the article in a comparison-first structure; updated CPI, Treasury bill, money market, and I Bond inputs; corrected reinvestment, I Bond timing, real-return math, and account-access guidance; removed stale numerical graphics and the unsupported five-year projection; and added one dated brokerage interface image.
- v1.3 2026-07-26 REPAIR Separated the bill’s actual 28-day cash flow from the constant-price one-year model, converted the auction price to an effective annual return for the break-even calculation, archived the CPI source, removed the unsupported historical VUSXX tax percentage, and repaired the Gutenberg paragraph-image boundary.
- v1.4 2026-07-28 UPDATE Converted internal editorial links to root-canonical URLs, narrowed the TreasuryDirect reinvestment explanation to the official rule, linked Fidelity’s Auto Roll interest treatment, and clarified the dated Vanguard VUSXX yield.
- v1.5 2026-08-23 REPAIR Refocused the guide on cash-reserve layering by need date, reduced product-by-product encyclopedia structure and repeated keyword phrasing, clarified the boundary with the site’s comparison articles, preserved the dated calculations, migrated the trust markup, and added the interactive cash-layer calculator.