
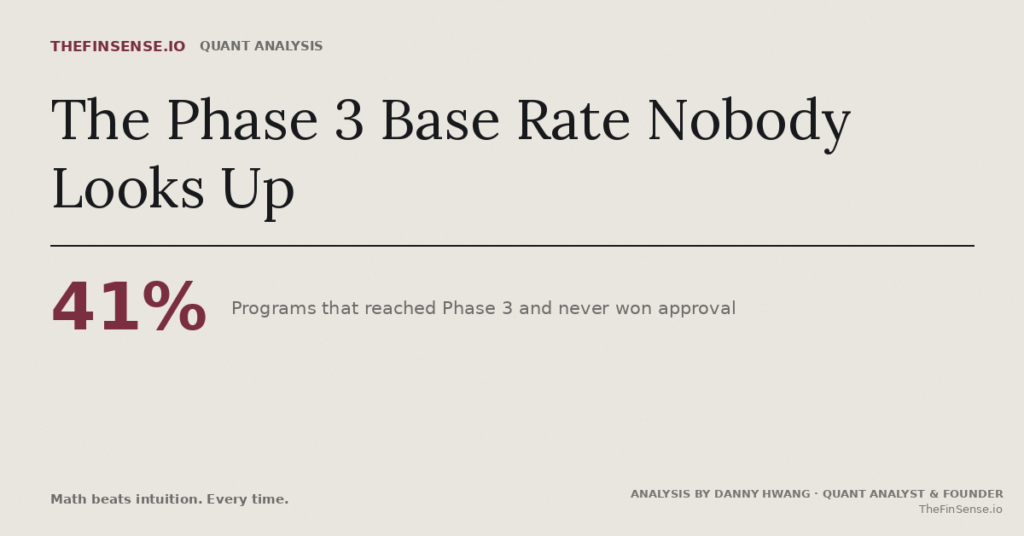
Of the drug programs that reached Phase 3 between 2000 and 2015, 59.0% won regulatory approval and 41.0% did not. The rate swings from 35.5% in oncology to 85.4% in vaccines, so the disease moves it far more than the phase label. It is a historical average across global industry-sponsored development, not a forecast for the stock you own.
What Phase 3 Actually Tells You
A drug in Phase 3 has already cleared safety and early efficacy. The company release leads with the endpoint met, the sell-side note already models a launch year, and the pipeline diagram on every explainer site ends at a single box marked approval. So the last step reads like paperwork.
Call it the formality assumption. It is a reasonable place to land, because every visual the industry publishes reinforces it. A pipeline diagram maps the regulatory sequence, and a map has to end somewhere. What it does not show is how often the last box opens.
That number has been in print since 2019. Wong, Siah and Lo traced 7,532 industry development programs that reached Phase 3 between 2000 and 2015 and counted how many ended in a license. The answer was 59.0%, with a standard error of 0.6.
📚 Source: Wong, Siah and Lo, 2019, Table 2 · academic.oup.com
The assumption is not wrong about direction. Most programs that get that far do finish. It is wrong about magnitude, and the size of the error is the whole story. Four in ten is not a tail event. It is the second-largest outcome, and it carries no warning label anywhere on the chart that put it there.
What the count actually counts
The unit matters more than it sounds, and most summaries of this paper get it wrong.
Wong, Siah and Lo count development paths, not drugs and not companies. One path is one drug aimed at one disease. A compound tested against three diseases appears three times. So the honest version of the headline is not “41% of drugs” but “41% of drug and disease combinations that entered Phase 3.”
That distinction has a practical edge. A company with four programs is not carrying one 59.0% bet. It is carrying four, and they do not resolve together.
IN PLAIN ENGLISH:
The 59.0% describes a population of programs over sixteen years. It does not describe your drug, and it was never built to.
So how much does that population figure move once you split it?
The Same Phase, Odds That Differ by 2.4x
The 59.0% is an average, and the average hides the one line that actually describes your holding.
Wong, Siah and Lo split the same 7,532 paths into nine therapeutic groups. Vaccines finished at 85.4%. Oncology finished at 35.5%. Every one of those programs carried the identical Phase 3 label.
| Therapeutic group | Phase 3 to approval |
|---|---|
| Vaccines | 85.4% |
| Infectious disease | 75.3% |
| Ophthalmology | 74.9% |
| Genitourinary | 66.5% |
| Autoimmune / Inflammation | 63.7% |
| Cardiovascular | 62.2% |
| Metabolic / Endocrinology | 51.6% |
| CNS | 51.1% |
| Oncology | 35.5% |
| Therapeutic group | Paths | Approved | SE | Did not |
|---|---|---|---|---|
| Vaccines (infectious disease) | 609 | 85.4% | 1.4 | 14.6% |
| Infectious disease | 1,078 | 75.3% | 1.3 | 24.7% |
| Ophthalmology | 207 | 74.9% | 3.0 | 25.1% |
| Genitourinary | 212 | 66.5% | 3.2 | 33.5% |
| Autoimmune / Inflammation | 969 | 63.7% | 1.5 | 36.3% |
| Cardiovascular | 964 | 62.2% | 1.6 | 37.8% |
| Metabolic / Endocrinology | 1,101 | 51.6% | 1.5 | 48.4% |
| CNS | 1,156 | 51.1% | 1.5 | 48.9% |
| Oncology | 1,236 | 35.5% | 1.4 | 64.5% |
| Overall | 7,532 | 59.0% | 0.6 | 41.0% |
📚 Source: Wong, Siah and Lo, 2019, Table 2 · academic.oup.com
The nine group counts add to 7,532 exactly, which is worth saying because it means nothing has been dropped or merged in the table above. I recomputed each row against the published table rather than taking it from a secondary summary.
Read the standard errors before you read the rate
The standard error column is doing real work here, and most reproductions of this table leave it out.
The overall 59.0% rests on 7,532 paths and carries an SE of 0.6, which is tight. Ophthalmology’s 74.9% rests on 207 paths with an SE of 3.0, and genitourinary’s 66.5% rests on 212 with an SE of 3.2. Those two rows are directions, not numbers. A rate built on two hundred observations can move as more programs report.
The working rule is short. Tight band, read the number. Wide band, read the direction.
A 2019 corrigendum corrected a spreadsheet formatting error in the source paper’s tables. It touched the Phase 2 to 3 columns and the Phase 3 to approval column of Table 1, not the Table 2 group rates above.
📚 Source: Biostatistics corrigendum, 2019, 20(2):366 · doi.org
Before you apply that row to a holding, there is a scope problem worth knowing about.
Why This Is Not Your Drug’s FDA Probability
This is the section most write-ups of this paper skip, and skipping it is how a useful base rate turns into a bad forecast.
Three limits travel with every number on this page.
It measures regulatory approval, not FDA approval
Wong, Siah and Lo built their sample from Citeline data covering United States and non-United States sources. Approval in their table means a drug won a license from a regulator, not specifically from the FDA. If your position turns on a single United States decision, this rate is adjacent evidence rather than direct evidence.
An FDA-specific counterpart does exist, and comparing the two is more instructive than picking one. The BIO, Informa and QLS Advisors report on clinical development success covers 1 January 2011 to 30 November 2020 and restricts itself to company-sponsored programs run for FDA registration. Approval there means FDA approval, full stop.
| Phase 3 to approval | Wong, Siah and Lo | BIO, Informa, QLS |
|---|---|---|
| All indications | 59.0% | 52.4% |
| Oncology | 35.5% | 43.9% |
| Window | 2000 to 2015 | 2011 to 2020 |
| Regulator | Global | FDA only |
| Method | Path-by-path | Phase-by-phase |
| Counting unit | Drug and disease path | Registration program |
📚 Sources: Wong, Siah and Lo, 2019, Table 2 · BIO, Informa Pharma Intelligence and QLS Advisors, 2021 · go.bio.org
Look at the oncology row, because it does something the overall row does not. The FDA-only dataset is lower on all indications and higher on oncology, 43.9% against 35.5%. Both figures are correctly transcribed from their sources. They disagree because the samples, the windows, the counting units and the arithmetic all differ, and neither one is the corrected version of the other.
That is the whole argument of this section in one table row. A base rate is not a fact about your drug. It is a fact about a dataset, and swapping the dataset can move the number by eight percentage points in the direction you least expect. Use whichever one matches your question, name it when you quote it, and do not blend them.
Two structural notes if you go to the primary sources yourself. BIO classifies vaccines as a drug modality rather than a disease area, so there is no vaccine row to line up against the 85.4% above. And a Citeline analysis of phase transitions from 2014 to 2023 puts the overall Phase 1 to approval likelihood at 6.7%, down from BIO’s 7.9%. Both sit on the same Biomedtracker series that produced the widely quoted 10.4% in 2014 and 9.6% in 2016, so that decline is measured on consistent data rather than assembled from separate studies. The 2014 to 2023 update has not been published with the full program counts the 2011 to 2020 report carries.
📚 Source: Citeline, Why Are Clinical Development Success Rates Falling?, 2024 · norstella.com
It is a category history, not an individual probability
A 35.5% oncology rate is what happened to 1,236 oncology programs over sixteen years. It is not the probability that your oncology drug gets approved.
Your drug has a trial design, an endpoint, a comparator, a manufacturing record and a review history, and none of those are in the table. The base rate tells you what the neighborhood looks like. It does not tell you which house you bought.
The window closed in 2015
The sample ends on 31 October 2015. Accelerated pathways, biomarker-guided trials and the review environment have all moved since. The paper itself found overall success falling from 2005 to 2013 and rising after, which is a reminder that this rate is a measurement of a period rather than a constant.
The most recent phase-transition data points lower rather than higher. Citeline’s 2014 to 2023 figures give a 55% Phase 3 transition and 92% approval on filing, which multiply to roughly 51%. Both inputs are rounded and the dataset is published without program counts, so read that as a direction on where the number has moved since the window closed, not a replacement for the 59.0%.
Between 2000 and 2015, 41.0% of global industry drug and disease programs that reached Phase 3 did not go on to regulatory approval, and the rate varied by more than a factor of two across therapeutic groups. That is a historical base rate worth knowing before a decision date. It is not an FDA-specific probability, and it is not a forecast for any individual application.
Knowing the odds is only half of it, because the two outcomes do not pay symmetrically.
Why a Rejection Costs More Than an Approval Pays
There is a second published asymmetry sitting underneath the first, and it points in an uncomfortable direction.
Thomas Hwang, then at Harvard, ran an event study on announcements of clinical trial results from large United States-listed biopharmaceutical companies between January 2011 and May 2013. He found 24 events, 16 positive and 8 negative. On the announcement itself, the median cumulative abnormal return was 0.8% for the positive events and negative 2.0% for the negative ones. A day later the positive median had faded to 0.4% and stopped clearing significance, while the negative median stayed significant.
📚 Source: Hwang, PLOS ONE, 2013 · journals.plos.org
Stock return underperformance due to negative events is greater in magnitude and persists longer than abnormal returns due to positive events
Thomas J. Hwang, PLOS ONE, 2013
What that finding does and does not license
It would be easy to multiply those two figures by the 59.0% approval rate and produce a tidy expected drag on a portfolio. That calculation does not hold, and it is worth saying why, because versions of it circulate.
Four problems break it. The events are different, since Hwang measured reactions to trial results and the 59.0% measures regulatory outcomes. The samples are different, since Hwang studied large-cap firms and the 59.0% covers global programs of every sponsor size. The statistics do not combine, because a probability-weighted blend of two conditional medians is not an expected value, and Hwang reported medians under a signed-rank test precisely because the sample was too small for parametric estimates. And 24 events is not enough to support a portfolio-level projection in any case.
So this page does not run that arithmetic. What survives is the direction, and the direction is still useful.
The two medians sit roughly two and a half to one against the holder. That ratio is a property of Hwang’s small sample of large-cap announcements, not a portfolio drag and not a forecast. Read it as a reason to expect the downside day to be bigger than the upside day, and nothing further.
One related finding points the same way without closing the gap. Cho, Singh and Lo analyzed news reactions across a much larger set of biopharma firms and reported that smaller companies tend to move more sharply on product-development news than larger ones. Hwang’s sample was large-cap. A concentrated small-cap holding is not the population he measured, and that is a reason for caution rather than a number to substitute in.
📚 Source: Cho, Singh and Lo, PLOS ONE, 2024 · journals.plos.org
Which leaves the only part of this you can actually act on.
How to Look Up Your Own Holding
Everything above is background until you run it against a ticker. This takes about ten minutes and you only have to do it once per position.
Rosa is 41 and reads Phase 3 data for a living as a hospital pharmacist. She can read a Kaplan-Meier curve without slowing down. A decision date for a drug she already owns sits on her calendar. She opens the Positions tab, where the ticker sits above a line reading Today’s change, and that line has never once shown her the denominator she reads every week at work.
Rosa is a hypothetical composite, not a real individual.
Six checks before a decision date
- Find the indication, not the drug. Search the company on ClinicalTrials.gov and read the Conditions field on the Phase 3 record, or open the indication column of the company’s pipeline page. That phrase is what maps to a row in the table above.
- Read the row, then read its standard error. If the SE is 3.0 or higher, treat the rate as a direction rather than a figure.
- Check whether this is a first review or a resubmission. A program returning after a complete response letter is in a different situation from one arriving for the first time, and the historical base rate does not separate the two.
- Find out what kind of deficiency is at issue, if one is known. A manufacturing or labeling problem and a request for another trial are both complete response letters. They are not the same event for a shareholder.
- Work out how much cash a delay costs. Wong, Siah and Lo found terminated Phase 3 trials concluded about 3.2 months after advanced ones, which flips the sign from Phase 2, where terminated trials end 8.1 months sooner. A Phase 3 program running long is not the reassurance it reads like, and on a single-asset balance sheet those months are burn. That is closer to a solvency question than a regulatory one.
- Size the position to one bad morning. Nobody publishes a target percentage and this page will not invent one. The workable test is whether a single decision going against you would force a decision you do not want to make.
📚 Source: Wong, Siah and Lo, 2019, section 4.5 · academic.oup.com
Two habits keep check six from being re-argued every time a decision date lands. Write the group rate and the size limit into an investment policy statement before you need them, and let a rebalancing strategy pull the position back when a good year stretches it past what you agreed to.
How much of this reaches you depends on the wrapper
Three readers carry this base rate very differently, and two of them barely carry it at all.
If you hold one biotech name, the therapeutic group is close to being your real position size, and a single decision lands undiluted. If you hold a sector fund, dozens of programs sit inside the basket and one complete response letter is diluted rather than removed. If you own large-cap pharma inside a broad index, you already have the diversification without having chosen it, and no single decision date reaches your balance in a recognizable form.
That choice of wrapper is an asset allocation decision made well before any drug-specific odds apply, and the ETFs versus mutual funds question decides the tax and trading detail on top of it.
The obvious objection is that the market already knows all of this. It probably does, at least in aggregate. But an efficient price for the sector’s average program is not the same as the right position size for a specific holding whose published category rate is 35.5%. Nothing here is an edge over the market. It is a check on how much of your own money is standing on one row of a table.
Which row is yours?
Common Questions
Is FDA approval guaranteed after Phase 3?
No. In the largest published count of that transition, 59.0% of the 7,532 industry programs that reached Phase 3 between 2000 and 2015 went on to regulatory approval and 41.0% did not. Two caveats matter. The count is of drug and disease combinations rather than individual drugs, so one compound tested against three diseases appears three times. And the sample covers global regulators rather than the FDA alone, so it is a useful reference point for a United States decision rather than a direct measurement of one.
How often do Phase 3 drugs get approved?
The published overall figure is 59.0%, with a standard error of 0.6 on 7,532 development paths. It is not one number in practice. Oncology programs finished at 35.5% and vaccine programs at 85.4%, a spread of more than a factor of two across the same phase label. Hay and colleagues, working from a different database over 2003 to 2011, published a 60.1% Phase 3 transition rate and an 83.2% approval rate on filing. Multiply those and the same step comes out at 50.0%, on an FDA-based path rather than a global one, which is a reminder that this rate is measured rather than known.
What exactly is a complete response letter?
A complete response letter means the FDA will not approve an application in its current review cycle because of deficiencies it has identified. It is not necessarily a permanent refusal. A sponsor can address the deficiencies and resubmit, and many do. The economic weight of a letter therefore depends on what it asks for. A labeling or manufacturing fix and a demand for an additional trial are both complete response letters, and they are very different events for a shareholder, particularly one holding a company with a single asset and limited cash.
Should I sell before a PDUFA date?
This page does not give that answer, but two facts are worth having first. A PDUFA date is the FDA’s performance goal date for acting on an application, not a guaranteed decision day, and timelines can extend. And in Hwang’s small event study of large-cap announcements, the negative median move was larger than the positive one and stayed statistically significant for longer. That asymmetry is a reason to size a position before a decision date rather than to trade around one. If a sale does happen at a loss, the tax loss harvesting rules cover what a taxable account may do next.
Why did the stock fall on an approval?
Usually because the approval was already in the price. Hwang measured a median announcement-day move of 0.8% on positive clinical readouts against negative 2.0% on negative ones. The upside is small because expectation has largely absorbed it, and the downside is larger because expectation has not. Those figures come from 24 events at large firms between 2011 and 2013, so treat them as the shape of the reaction rather than the size of any particular day.
The Bottom Line
Wong, Siah and Lo did not publish a forecast. They published a count, and 59.0% of the programs that reached Phase 3 in their sixteen-year sample ended in a license.
What that count is good for is narrow and real. It tells you the last box on the pipeline chart opens about six times in ten, and that the figure moves from roughly a third to roughly six in seven depending on the disease. What it is not good for is predicting a specific application, which is a limit worth carrying rather than arguing with.
Two published numbers, then. The base rate says the odds vary by more than double across the same phase. The event study says the bad day tends to be bigger than the good one. Neither requires a model to be useful, and neither is in the price of most retail positions because most holders have never opened the table.
Open your biotech holding and find the indication. If it reads oncology, the two published datasets put the historical Phase 3 rate at 35.5% and 43.9% depending on which one you ask, and both of those have been in print for years. Either number is a better starting point than the one most holders carry into a decision date, which is no number at all.
Your turn. Which therapeutic group is your biotech holding in, and did you know the number before today?
What is measured. All nine therapeutic-group rates, path counts and standard errors are transcribed and independently rechecked against Table 2 of Wong, Siah and Lo (2019). The counting unit is a drug and disease development path, not a drug. The sample is industry-sponsored programs from 1 January 2000 to 31 October 2015, drawn from Citeline data covering United States and non-United States sources. Approval means regulatory approval, not FDA approval specifically.
Second dataset. The FDA-only comparison figures come from BIO, Informa Pharma Intelligence and QLS Advisors, Clinical Development Success Rates and Contributing Factors 2011-2020, covering 1 January 2011 to 30 November 2020 across 12,728 phase transitions from 9,704 company-sponsored, FDA registration-enabling programs at 1,779 companies. That report uses phase-by-phase compounding: Phase 3 to filing of 57.8% multiplied by filing to approval of 90.6% gives the 52.4% quoted above. Oncology Phase 3 to approval is 43.9%. The two datasets are reported side by side and never combined.
Prior estimates. The 50.0% quoted in the FAQ is not a published Phase 3 to approval rate. It is the product of two rates Hay and colleagues (2014) do publish, a 60.1% Phase 3 transition and an 83.2% approval rate on filing, over a 2003 to 2011 BioMedTracker sample of 7,372 development paths. That is the same compounding used for the BIO figure above, and it produces an FDA-based rather than a global rate. The Citeline 2014 to 2023 figures quoted in the scope limits, a 55% Phase 3 transition and 92% approval on filing, are published rounded and without program counts, so the roughly 51% product carries no standard error and is reported as a direction only.
What is not calculated. This page deliberately does not combine the 59.0% approval rate with published announcement returns to produce an expected portfolio drag. The two figures measure different events on different samples, and a probability-weighted blend of two conditional medians is not an expected value. An earlier draft of this article carried such a model and it has been removed.
Event-study figures. Hwang (2013) reports medians under a Wilcoxon signed-rank test on 24 announcements from large United States-listed firms between January 2011 and May 2013. Small-sample medians describe that sample. They are not population parameters.
Regulatory status. The FDA published more than 200 redacted complete response letters in July 2025 and announced a real-time publication policy in September 2025. Publication was paused in April 2026 following a citizen petition, and further letters were posted in July 2026, so the position is unsettled. The statutory deadline for the FDA to answer the petition is 17 October 2026. Reporting as of July 2026.
Update log
- 27 July 2026. Two figures carried no visible source. The 50.0% prior estimate is now attributed to Hay and colleagues (2014) and identified as the product of two published rates rather than a published rate. The Citeline 2014 to 2023 likelihood of approval is now attributed and linked. A Phase 3 figure from the same Citeline update was added to the scope limits.
- July 2026. Initial publication.
Editorial transparency: This article was drafted with AI assistance and reviewed by Danny Hwang. Every figure was rechecked against the primary publication. Methodology and correction policy are open at /editorial-policy/.
Changelog
- v1.127 July 2026CORRECTIONTwo unattributed figures sourced. 50.0% traced to Hay et al. (2014) and labelled as derived. Citeline 2014-2023 LOA attributed and extended to the Phase 3 step. 8 sources.
- v1.026 July 2026PUBLISHOriginal publication. 6 sources at publish. 4010 words.