
📅 Originally Published: · Last Updated:
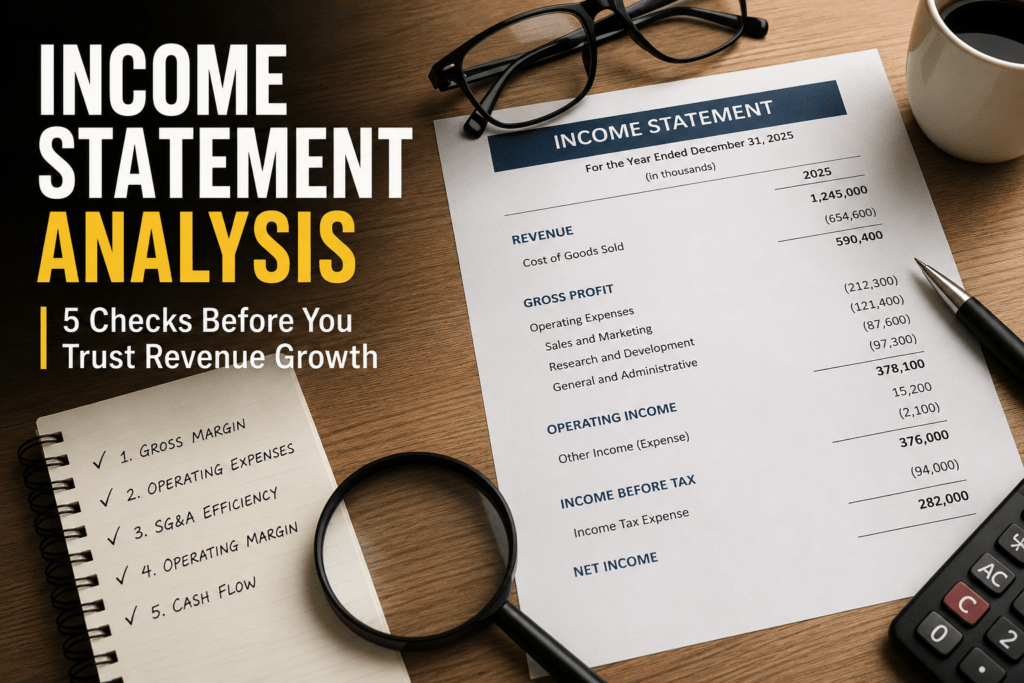
Income statement analysis should answer one practical question: did revenue growth reach profit? Start with gross margin and expense growth. Then compare selling, general and administrative (SG&A) and research and development (R&D) as a share of revenue, operating margin, and cash. If those layers move in different directions, the gap tells you where to look next.
Revenue is the easiest number in an earnings release to cheer. It tells you that customers bought more. It does not tell you how much of that growth survived product costs, hiring, sales commissions, research spending, or the overhead needed to support a larger company.
That missing information can change how you read an earnings report. A revenue beat may strengthen a thesis, or it may be the reason to slow down and read the expense lines. The difference becomes clearer when you follow the statement in order instead of treating the top line as the verdict.
The Five Income Statement Checks Before You Trust Revenue Growth
Begin with the question that brought you to the filing, then move down the statement one layer at a time. Each step narrows down where the business changed.
| Check | Calculate or Compare | What It Can Reveal | Next Question |
|---|---|---|---|
| 1. Revenue | Year-over-year and sequential growth | Demand, pricing, acquisitions, or currency effects | Did gross profit keep pace? |
| 2. Gross margin | Gross profit divided by revenue | Changes in pricing, product mix, or direct costs | If margin fell, what changed in cost of revenue? |
| 3. Operating expenses | Expense growth versus revenue growth | Whether the cost base expanded faster than sales | Which category caused the increase? |
| 4. Expense ratios | SG&A and R&D divided by revenue | Where leverage improved or weakened | Is the change short-term, deliberate, or structural? |
| 5. Profit and cash | GAAP margin, cash from operations, and adjustment bridges | How much reported growth reached profit and cash | Do exclusions or working-capital changes explain the gap? |
These checks are diagnostic, not automatic sell rules. A falling margin may reflect a product launch that later pays off. A higher R&D share may reflect planned investment rather than weaker results. Find the source of the change, then judge whether the company’s explanation fits the numbers.
Avoid one-size-fits-all red flags. A 200-basis-point margin change can be routine in one industry and alarming in another. Compare the company with its own history, direct peers, stated plan, and business model.
What SG&A Cost Stickiness Actually Means
Cost stickiness means that some costs do not fall as quickly as sales. Anderson, Banker, and Janakiraman studied annual Compustat data from 1979 through 1998. Their base sample contained 64,663 firm-year records from 7,629 industrial firms. The pooled regression removed 705 extreme records. Its estimates implied about a 0.55% SG&A increase for a 1% sales increase and about a 0.35% decrease for a 1% sales decline.
Those percentages describe changes in SG&A itself. They are not percentages of revenue, company profit, or a stock price. Any dollar translation has to start with the prior SG&A balance, not with portfolio value.
A Correct Translation of the Paper’s Coefficients
Consider an illustrative company with $1 billion of annual revenue. Use the study’s sample-average SG&A ratio of 26.41%, then assume revenue falls 4%. The paper’s log model gives the following comparison.
| Step | Calculation | Result |
|---|---|---|
| Sticky-cost path | 0.960.3545 | SG&A falls to 98.56% of its prior level |
| Symmetric reference path | 0.960.5459 | SG&A falls to 97.80% of its prior level |
| Difference | 98.56% minus 97.80% | 0.77% of the prior SG&A balance |
| Dollar illustration | $1 billion × 26.41% × 0.77% | About $2.03 million |
| Operating-profit context | $2.03 million divided by $120 million | About 1.69% of operating profit at a 12% operating margin |
The difference is still economically relevant because sticky costs can slow margin recovery when sales weaken. But the paper does not establish a stock-price haircut or a long-horizon return gap. Either claim would need a separate model linking the accounting change to valuation and future returns.
The study also found that stickiness varied with firm conditions and became less pronounced over longer periods. Treat the 0.55 and 0.35 estimates as historical sample results, not fixed company thresholds.
A Real Filing Example: monday.com Q4 2025
monday.com reported a strong revenue headline for the quarter ended December 31, 2025. Revenue reached $333.9 million, up 25% year over year. Reading further down the same statement turns that headline into a more useful diagnosis.
| Metric | Q4 2025 | Q4 2024 | What Changed |
|---|---|---|---|
| Revenue | $333.878 million | $267.976 million | Up 24.6% |
| Gross margin | 88.8% | 88.6% | Up about 20 basis points |
| Sales and marketing plus G&A as a share of revenue | 62.7% | 61.8% | Up about 89 basis points |
| R&D as a share of revenue | 25.4% | 23.3% | Up about 217 basis points |
| Total operating expenses | $294.160 million | $227.878 million | Up 29.1%, faster than revenue |
| GAAP operating margin | 0.7% | 3.6% | Down about 287 basis points |
| Operating cash flow | $59.7 million | $76.7 million | Down about 22% |
The gross-margin check passes: direct costs were stable. The pressure appeared below gross profit. R&D grew faster than revenue, total expenses rose 29.1%, and the GAAP operating margin narrowed. That combination explains why 25% revenue growth did not produce profit growth.
The release also reported a non-GAAP operating margin of 13%, down from 15%. In its non-GAAP bridge, monday.com estimated that currency hurt the margin by about 180 basis points. That context matters because it shows why the adjustment bridge deserves a read rather than choosing whichever profit measure looks better.
This example does not say monday.com was a bad business or that its shares should have been sold. It identifies the decision that remained after the headline: was the heavier spending a productive investment, an FX-driven short-term squeeze, or the start of weaker leverage? Company comments, the adjustment bridge, customer metrics, guidance, and later quarters have to answer that question.
This same sequence can be run on any two comparable periods. The defaults reproduce monday.com Q4 2025 versus Q4 2024. Replace both columns with any company’s comparable periods, using the same units and accounting basis.
Income Statement Analyzer
Compare revenue, gross profit, operating expenses, operating income, and operating cash flow across two periods. Use the same dollar unit in both columns, such as $ millions.
If total operating expenses outgrow revenue, inspect SG&A and R&D separately before deciding whether the change is temporary, deliberate, or structural.
Why Gross Profit Deserves More Attention Than Revenue Alone
Gross profit combines sales with the direct cost required to generate them. That gives it a signal that revenue cannot carry by itself.
Chiu and Haight studied 269,967 firm-quarter records covering 10,005 firms from 1977 through 2010. Their portfolio tests found a return spread across gross-profit-surprise groups over a three-month window that began in the fourth month after the fiscal quarter-end. In separate multivariate regressions, gross-profit surprises kept extra return signal after other accounting signals were included, while the contribution from revenue surprises weakened.
The study supports a narrow conclusion: gross-profit surprises contained extra signal in that historical sample and research design. It does not mean a higher gross margin predicts a rising stock. It also does not mean a reader can copy the paper’s decile strategy without shorting, trading costs, risk controls, and careful data timing. For a filing reader, the takeaway is simpler: when revenue surprises you, inspect the gross profit that came with it.
A Five-Minute Income Statement Workflow
- Match the period and basis. For a seasonal business, compare the quarter with the same quarter a year earlier. Keep GAAP with GAAP. If the company highlights an adjusted measure, read the bridge before using it in a trend.
- Recalculate the ratios. Divide gross profit and the main expense lines by revenue. Raw statement values show whether a ratio moved by a few basis points or enough to change the story.
- Find the line that changed. If direct margins held but profit weakened, move to SG&A, R&D, restructuring charges, and stock-based pay. Then read the notes and company discussion for hiring, commissions, acquisitions, currency, or one-time items. For a deeper filing workflow, use the TheFinSense guide to reading a 10-K and 10-Q.
- Compare profit with cash. A profitable quarter can still convert poorly to cash because of receivables, deferred revenue, inventory, or other working-capital moves. Continue with the cash flow statement analysis guide.
- Set the next test. Write down what would confirm or weaken your view next quarter, such as better margins, slower expense growth, lower stock-based pay, or stronger cash conversion.
FASB ASU 2024-03 will add more expense detail to the notes for public business entities. It is effective for annual reporting periods beginning after December 15, 2026, and for interim periods within annual reporting periods beginning after December 15, 2027. The added detail should help readers trace expense changes, but the notes, adjustment bridges, and company discussion will still matter.
When the sales headline looks unusually strong, the companion guide on revenue growth and accrual quality checks whether the reported expansion is supported by the balance sheet and cash collection.
Frequently Asked Questions About Income Statement Analysis
What should I check first on an income statement?
Start with sales, then calculate how much remained after direct costs. That first comparison tells you whether the headline growth arrived with stable direct margins or with new pressure on the business.
Is rising SG&A always a warning sign?
No. SG&A can rise because a company is hiring salespeople, entering a market, or building systems for future growth. Compare its growth and revenue share with the company’s plan and later results. The concern is unexplained or persistent spending that fails to support sales, margin, or cash.
Should I compare income statements quarter over quarter or year over year?
Use both, but lean on the same quarter a year earlier when the business is seasonal. Quarter-to-quarter changes can still flag a sudden shift. Keep the period length, accounting basis, and major one-time items consistent before drawing a conclusion.
Should I use GAAP or adjusted profit?
Start with GAAP, then review the non-GAAP bridge. Non-GAAP measures can clarify recurring operations, but they may exclude stock-based pay, restructuring, or other real costs. Track both consistently and judge each exclusion rather than accepting the adjusted figure automatically.
Can an income statement predict a stock’s return?
No single line can reliably predict an individual stock’s return. The statement helps you test what changed inside the business. Price, expectations, competition, balance-sheet risk, and market conditions still shape the investment result.
The Bottom Line on Income Statement Analysis
Do not stop at the sales headline. Follow the quarter through direct costs, expenses, profit, and cash. When those layers disagree, the gap tells you where to look and what the next quarter needs to prove.
YOUR TURN
Which line changed the story in the latest earnings report you read: gross margin, SG&A, R&D, operating margin, or cash flow?
- Anderson, Banker, and Janakiraman (2003): Are Selling, General, and Administrative Costs Sticky? The article separates the 64,663-record base sample from the pooled regression after 705 extreme records were removed, and uses the reported 26.41% sample-average SG&A share for the illustration.
- Chiu and Haight (2014): Gross Profit Surprises and Future Stock Returns. The article separates the portfolio tests from the multivariate regressions and preserves the paper’s delayed three-month return window.
- monday.com: Q4 and fiscal-year 2025 results, released February 9, 2026. All displayed ratios were recalculated from the reported statement values. The calculator defaults use the five Q4 statement values shown in the article for 2025 and 2024.
- Financial Accounting Standards Board: ASU 2024-03 project summary and effective-date clarification.
Calculator method: The tool applies the five formulas shown beside the calculator to the two entered periods. It suppresses percentage growth when a prior-period cash-flow or expense base is not a valid positive denominator, instead of forcing a misleading rate. Its diagnostic label is a reading aid, not an investment signal.
Cross-check: The article compares direct-cost, expense, profit, and cash evidence before reaching a company-level interpretation.
AI disclosure: AI assisted with source organization, calculation checks, and copyediting. Load-bearing figures were checked against the primary sources listed above, and derived values were independently reproduced before publication.
Update history
- Version 2.2 August 16, 2026 Interactive analysis tool Added a two-period income statement analyzer that reproduces the article’s sales, direct-cost, expense, operating-profit, and cash checks without turning them into a stock-return signal.
- Version 2.1 August 16, 2026 Precision and standards update Clarified the research sample and return-window language, canonicalized internal links, tightened the workflow, added the current financial disclosure, and refreshed the trust package without changing the article’s core thesis or case study.
- Version 2.0 July 17, 2026 Major factual correction Removed the unsupported $100,340 portfolio claim and 6.67% repricing assumption, restored the correct SG&A denominator, recalculated the monday.com filing example, and rebuilt the article as a decision router.
- Version 1.0 April 14, 2026 Original publication Initial article published.