
📅 Originally Published: · Last Updated:
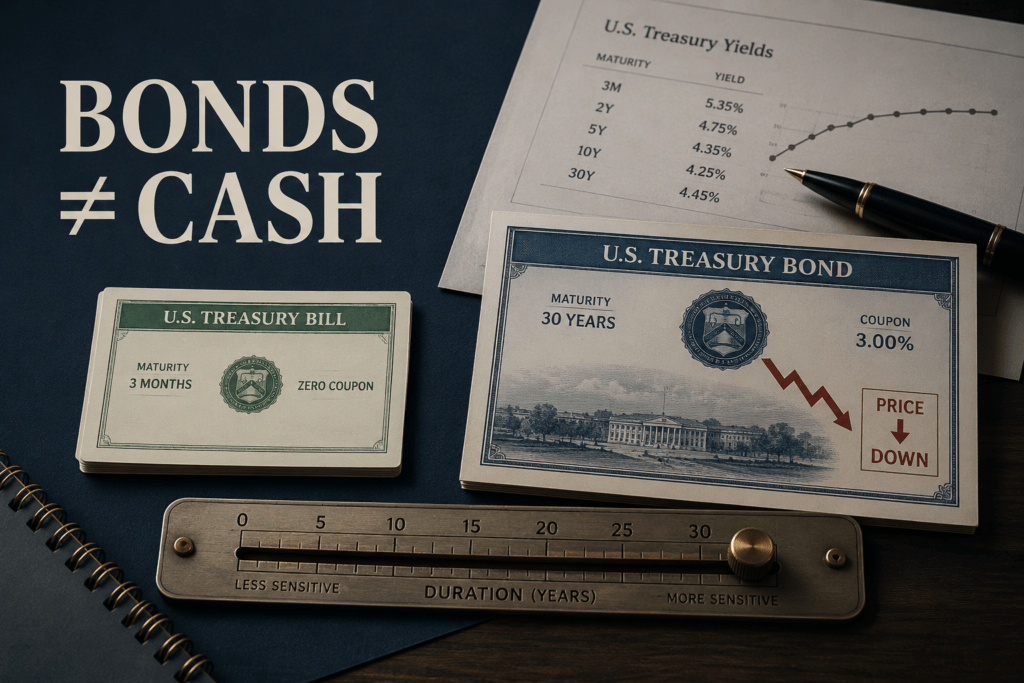
Answer first: A bond is a loan, but a bond investment is not automatically cash-like. Its market value moves when yields change, and the size of that move is largely controlled by duration. In 2022, the iShares 20+ Year Treasury Bond ETF (TLT) posted a −31.41% net asset value total return even though its holdings were United States Treasury securities. For planning, match the bond’s maturity or the fund’s duration to the date you may need the money.
A Three-Year Cash Need Can Still Carry Long-Duration Risk
Nora has $100,000 set aside for a home purchase in about three years. She wants more income than a checking account offers, so she opens a brokerage screen and sees two Treasury ETFs. Both hold United States government debt. One looks conservative because the word “Treasury” is in the name. The other looks less exciting because it owns short-term securities.
The Treasury label alone does not settle the risk; the maturity range and duration matter more. As of July 30, 2026, iShares reported an effective duration of 14.98 years for TLT and 1.79 years for the iShares 1–3 Year Treasury Bond ETF (SHY). Those are dated fund characteristics, not permanent constants, but they show why two Treasury funds can behave very differently.
| Illustrative $100,000 Position | Effective Duration | Approx. Price Effect of a +1% Yield Move | Approx. Value Before Income |
|---|---|---|---|
| TLT snapshot | 14.98 years | −14.98% | $85,020 |
| SHY snapshot | 1.79 years | −1.79% | $98,210 |
| Difference | 13.19 years | 13.19 percentage points | $13,190 |
Method in brief: This sensitivity check uses the effective duration reported by iShares for TLT (14.98) and SHY (1.79) on July 30, 2026. It applies a one-percentage-point increase in each fund’s relevant yield to the same $100,000 starting position. Because this is a static price estimate rather than a trading backtest, there is no transaction date or lag. It leaves out income, expenses, spreads, taxes, the curved price-yield effect known as convexity, and yield-curve moves that are not uniform. The figures show approximate price exposure, not expected returns.
Credit quality and interest-rate sensitivity answer different questions. Treasury credit quality addresses whether promised payments will be made. Duration estimates how much the market price may move before those payments arrive. Nora’s three-year home fund should not quietly become a large bet on long-term yields.
In Plain English
“Government bond” describes who owes the money. “Duration” describes how much the price may move while you wait.
How Do Bond Prices, Yields, and Coupons Fit Together?
A bond is a debt security. The issuer borrows money and promises a schedule of interest and principal payments. That differs from a stock, which represents equity ownership. Our guide to how individual stocks work explains the ownership side of that contrast.
Why Does a Bond Price Fall When Yields Rise?
Suppose an existing bond pays a fixed coupon while newly issued bonds begin paying more. A buyer will not normally pay full price for the older, lower-paying bond. Its market price must fall until the return available at that lower price becomes competitive. The reverse happens when market yields fall: an older bond with a higher coupon becomes more valuable. That inverse relationship drives bond pricing in the secondary market.
FINRA describes duration as a measure of how much a bond investment is likely to change in value when interest rates move. The common approximation is:
Approximate price change ≈ −Duration × Change in yield
A duration of 7 suggests an approximate 7% price decline if the relevant yield rises by one percentage point. For the fund comparison above, the input is each issuer-reported effective duration. The estimate is local, not exact. Convexity, cash flows, and different movements across the yield curve can change the actual result.
The phrase “relevant yield” matters. A long-term Treasury fund responds mainly to long-term Treasury yields, not one-for-one to the federal funds rate. Multiplying a fund’s duration by the full change in the Fed’s overnight target rate therefore overstates the relationship and is the wrong calculation.
Coupon Rate and Yield to Maturity Are Not the Same Number
The coupon rate determines the scheduled interest payment based on face value. Yield to maturity reflects the price paid, the remaining coupon payments, and the gain or loss between the purchase price and the amount repaid at maturity. A discounted bond can have a low coupon and a much higher yield to maturity. A premium bond can show the opposite pattern. Understanding the mechanics therefore requires looking past the coupon and checking the price-based yield.
For an individual bond held to maturity, yield to maturity is useful because it estimates the annualized return if the issuer makes every payment and coupons are reinvested at the assumed rate. It is not a guaranteed realized return under every circumstance. Selling early, a call provision, default, taxes, or a different reinvestment rate can change the outcome.
Why Does an Individual Bond Feel Different From a Bond Fund?
An individual Treasury note has a stated maturity date. If it is held to maturity, Treasury pays the principal due at that date, subject to the terms of the security. Its market price can still fall before maturity, and an investor who sells early can realize a loss.
A conventional bond fund does not give each shareholder a personal par-value payment date. The fund keeps replacing securities as they mature or leave the index. Its duration may remain fairly stable, which means rate sensitivity remains in the portfolio. The fund can recover after a rate shock as it earns higher yields, but the timing of that recovery may not match the date an investor needs cash.
That distinction matters in a real plan. A fund may be convenient for ongoing allocation and rebalancing. An individual Treasury maturing near a known spending date may offer clearer nominal cash-flow timing. Neither structure is automatically better for every job.
Why Did a Treasury ETF Lose 31% in 2022?
The Federal Reserve began raising its target range in March 2022 and ended the year at 4.25%–4.50%. Bond yields across the curve rose sharply, though not by the same amount or at the same time. Long-duration bond prices fell because their distant fixed cash flows became less valuable when investors could demand higher yields.
BlackRock’s official performance table reports that TLT’s net asset value total return was −31.41% in calendar year 2022. Because this is the official calendar-year total return, it records the actual 2022 result rather than a modeled drawdown. It should not be described as a Treasury default. The underlying securities continued to make contractual payments. The ETF’s market value fell because long-term yields repriced. The episode shows what happens when a long-duration portfolio meets a fast change in required yield.
−31.41%
TLT net asset value total return in 2022, according to the iShares calendar-year performance table. Government credit exposure did not remove long-duration price risk.
The ETF structure matters here. TLT holds Treasury securities, but an ETF share is not a bank deposit and its market price is not guaranteed by the United States government. “Treasury-backed” can describe the fund’s holdings. It should not be read as a promise that the ETF cannot lose value.
The 2022 result also corrects a common overstatement about diversification. Bonds can cushion stocks in some recessions and disinflationary shocks. They are less dependable as a hedge when the same inflation and rate shock pressures both asset classes. A portfolio still needs a deliberate asset-allocation strategy, not a blanket assumption that every bond fund will rise whenever stocks fall.
How Should You Match a Bond to the Job?
Instead of asking whether bonds are safe in the abstract, ask which obligation they must fund, when it comes due, and which risk matters. A retirement portfolio, an emergency reserve, and a home down payment have different cash-flow requirements. A practical bond decision starts by assigning each dollar a job before choosing a ticker.
| Job for the Money | What Usually Matters Most | Instrument Features to Check | Main Trade-Off |
|---|---|---|---|
| Emergency cash or spending within a year | Liquidity and principal stability | T-bill maturity, bank insurance, money-market holdings, settlement time | Yield can reset lower |
| Known expense in one to five years | Cash available near a specific date | Individual Treasury or CD maturity, early-sale risk, callable terms | Less flexibility if the date changes |
| Ongoing portfolio ballast | Diversification and tolerable volatility | Fund duration, credit mix, expenses, rebalancing role | No personal par-value date |
| Inflation-linked future spending | Real purchasing-power protection | Treasury Inflation-Protected Securities (TIPS) maturity, real yield, duration, tax location | Market value can still swing before maturity |
Use the Liability Date Before You Use a Yield Screener
Start with the earliest realistic date the money could be needed. A bond or ladder that matures near that date reduces the chance that a forced sale determines the outcome. A bond fund can still fit, but its duration and expected recovery period should be compatible with the spending window.
Do not turn duration into a rigid rule that maturity must exactly equal the spending date. Cash-flow needs can be uncertain, and longer bonds sometimes earn more. The point is to make the mismatch visible. A three-year obligation paired with a 15-year-duration fund is a deliberate rate position, not a neutral parking place.
For Nora, the three-year home-purchase date comes before the yield ranking. A short Treasury fund or a ladder can still fluctuate or create reinvestment work, but either carries far less duration than TLT. SHY is not universally better, but its shorter duration fits this particular deadline more closely than a long-duration fund.
Credit Risk, Duration Risk, and Inflation Risk Need Separate Checks
Credit risk asks whether the issuer can pay. Duration risk asks how the market price reacts to yield changes. Inflation risk asks what the future payments will buy. A long Treasury can have low credit risk and high duration risk. A short high-yield corporate bond can have lower duration but much higher credit risk. One label cannot summarize all three.
Readers deciding how much fixed income belongs beside stocks can connect this analysis with portfolio rebalancing. Duration controls the behavior of the bond sleeve; rebalancing determines how that sleeve is used when asset prices diverge.
Which Tax and Execution Details Change the Result?
Direct Treasury Income Is Exempt From State and Local Income Tax
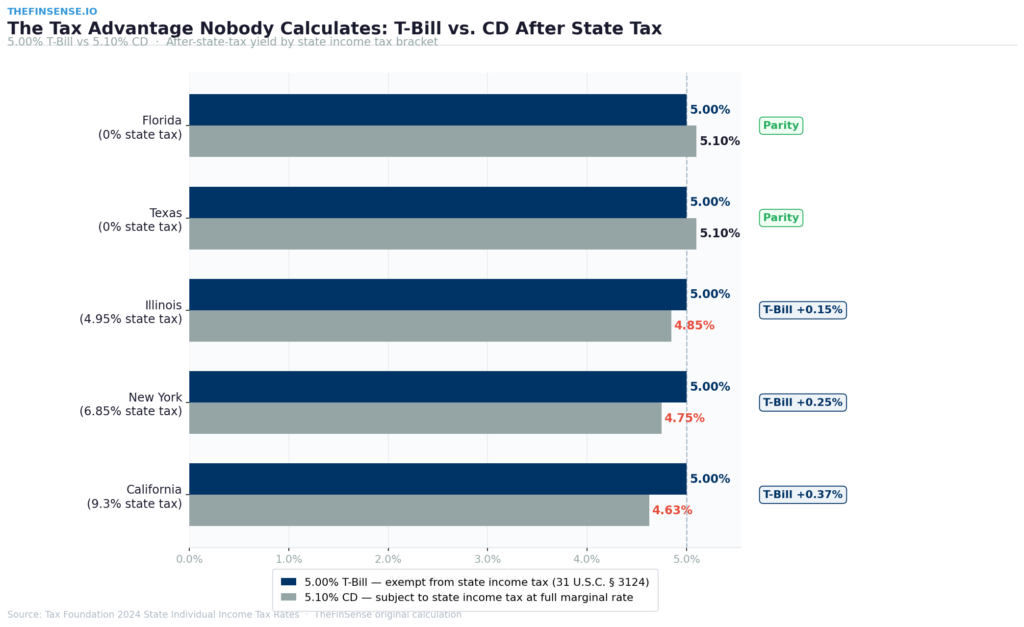
TreasuryDirect states that earnings from marketable Treasury securities are subject to federal tax but exempt from state and local income taxes. That treatment applies to Treasury bills, notes, bonds, TIPS, and floating-rate notes. Do not automatically extend the rule to every “government” or “agency” fund. A fund’s year-end tax supplement determines how much of its distribution qualifies in a particular state. For a real investor, bond mechanics include the source of the income and the tax bill attached to it.
A simplified state-tax comparison can still be useful. If a direct Treasury yields 4.00% and the investor’s state marginal rate is 9.3%, a fully state-taxable alternative would need to yield about 4.41% to match it before federal tax: 4.00% ÷ (1 − 0.093). The calculation assumes the same federal treatment and ignores deductions, phaseouts, and state-specific rules. Use it only as a rough screen; it does not replace a state-specific tax calculation.
For a deeper comparison of bills, savings products, and inflation protection, see how to protect savings from inflation. That article focuses on cash-like horizons; this guide focuses on broader bond mechanics.
Auto-Roll Reinvests Principal, Not the Interest
Fidelity’s Auto Roll service can place a new Treasury auction order with the same face value and term as the maturing position. Fidelity’s published methodology is explicit: only the maturing principal is applied to the next purchase. Coupon or interest payments remain in the account unless the investor moves them separately.
This is not a minor bookkeeping point. An investor expecting full compounding must decide what to do with the interest. They also need enough available buying power if the replacement order is placed before the old security settles. Brokerage procedures can differ, so confirm the current order and cash-reservation rules on the platform being used.
TreasuryDirect Starts at $100, but Convenience Has a Cost
TreasuryDirect allows noncompetitive purchases of marketable Treasury securities in $100 increments. A brokerage may offer an easier secondary market, consolidated statements, and automated reinvestment. TreasuryDirect avoids a brokerage intermediary but has a different interface and transfer process. The security determines the yield, while the platform determines the interface, statements, and transfer process.
TIPS Protect Principal From CPI at Maturity, Not From Every Interim Loss
TIPS principal adjusts with the Consumer Price Index, and semiannual interest is calculated from that adjusted principal. At maturity, Treasury pays at least the original principal amount. Before maturity, however, a TIPS price can still fall when real yields rise. A long-duration TIPS fund can therefore lose market value even while inflation remains elevated.
Taxable investors also need to account for annual federal taxation of inflation adjustments, even when that principal increase has not been paid in cash. Holding TIPS in a tax-advantaged account can simplify that mismatch, but account placement depends on the rest of the portfolio and should not be decided from one rule alone.
Frequently Asked Questions About How Bonds Work
Can I lose money on a Treasury bond?
You can realize a loss if you sell a Treasury before maturity after market yields have risen. An individual Treasury held to maturity pays the principal specified by its terms, but inflation can still reduce purchasing power. A Treasury ETF or mutual fund has no personal maturity date for the shareholder, so its market value can remain below the purchase price when the investor needs to sell.
Is duration the same as maturity?
No. Maturity is the date principal is scheduled to be repaid. Duration is a sensitivity measure that incorporates the timing of principal and coupon cash flows. A lower coupon generally pushes duration higher for otherwise similar bonds because more value arrives at maturity. Funds report portfolio duration even though the fund itself does not mature.
Does a duration of 7 mean the bond will always fall 7% when rates rise 1%?
No. The 7% figure is a first-order approximation for a small change in the bond’s relevant yield. Convexity changes the estimate for larger moves, and different parts of the yield curve rarely move in perfect parallel. Coupon income also affects total return. Duration is useful because it gives a common risk scale, not because it predicts an exact future price.
Are bond funds worse than individual bonds?
Not inherently. Bond funds offer diversification, simple reinvestment, daily liquidity, and easy rebalancing. Individual bonds can provide a known maturity date and a scheduled principal payment if held to maturity. A fund often fits an ongoing portfolio allocation. A maturity-matched individual bond or ladder may fit a known future expense better. The job determines the structure; the choice cannot be reduced to a fund-versus-bond slogan.
Should I buy the bond with the highest yield?
Yield alone is not enough. Higher yield may compensate for longer duration, weaker credit, call risk, lower liquidity, or unfavorable tax treatment. Compare yield to maturity, duration, maturity date, credit quality, call provisions, expenses, and the account where the bond will be held. A higher yield is a poor trade if the instrument cannot fund the obligation on time.
Bottom Line: Check the Date Before You Check the Yield
To understand how bonds work, separate the issuer’s cash-flow promise from the market price you could receive before maturity. The issuer promises cash flows. The market does not promise a stable resale price before those cash flows arrive. Duration connects the two by estimating how sensitive that resale price is to a change in yield.
Before buying a bond or bond fund, write down the date the money may be needed. Then check maturity, duration, credit quality, tax treatment, and the consequence of selling early. That order prevents a yield screen from turning short-term savings into a long-term rate bet.
TLT’s 2022 loss was not evidence that Treasury bonds stopped paying. It was evidence that low credit risk and low price volatility are not the same thing. Once that distinction is clear, bonds become easier to use because “safe” is replaced by a measurable question: safe for this purpose, on this timeline, under this set of risks?
Reader check
Open the fact sheet for your largest bond fund and find its effective duration. Is that number compatible with the first year you may need the money?
- iShares: TLT and SHY portfolio characteristics dated July 30, 2026; TLT calendar-year performance history for 2022.
- FINRA: Bond price-yield relationship, duration as an interest-rate sensitivity measure, and the risk of selling before maturity.
- United States Treasury: State and local tax exemption for marketable Treasury earnings, $100 minimum purchase increments, and TIPS principal-adjustment rules.
- Fidelity: Auto Roll uses the same face value and term for eligible Treasury auctions; only maturing principal is rolled, while interest stays in the account.
TLT official page · SHY official page · FINRA duration guide · Treasury tax rules · Fidelity Auto Roll methodology · Treasury TIPS rules
Keep reading: Protect savings from inflation · Build an asset-allocation strategy · Set a rebalancing rule
- July 31, 2026: Updated the TLT and SHY duration snapshot to July 30 issuer data, recalculated the full sensitivity table, clarified duration terminology, converted internal links to root-canonical URLs, and aligned the trust package with the current article standard.
- July 13, 2026: Rebuilt the guide around a three-year cash-need example, refreshed TLT and SHY data, corrected the rate-sensitivity and Auto Roll explanations, and updated sources and disclosures.
- March 19, 2026: Previous update.
- March 14, 2026: Originally published.